

The Platform
Everything inside.
Nothing held back.
Every tool on this platform exists for one reason: to sharpen your ability to see structure clearly, decide independently, and grow stronger under pressure. Not to tell you what to do. Not to predict. Not to generate signals.
Full platform access at every tier. Every tool below is yours from day one.
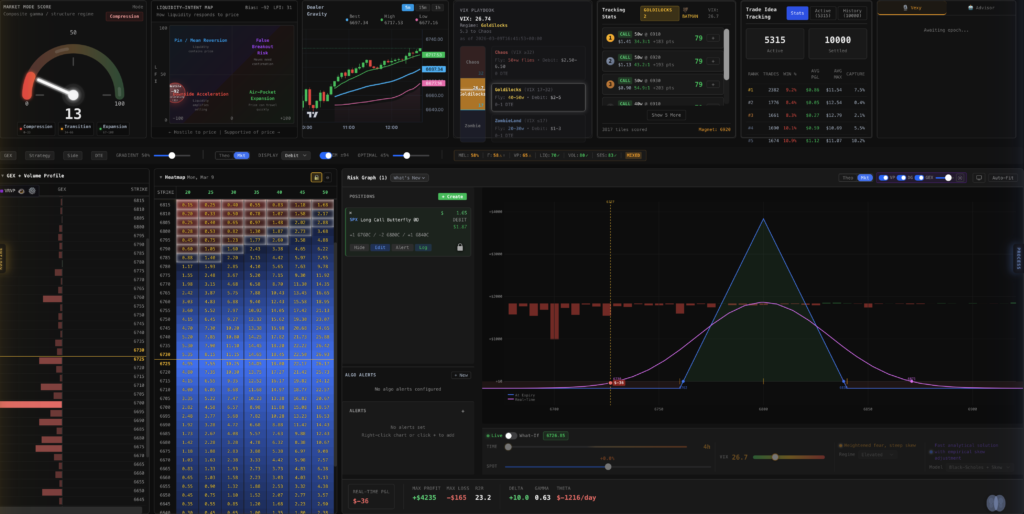
Market Structure — Before the Open
Three views. One story. Before 9:30 AM you have everything you need to orient.
Volume Profile — where the market agreed on price yesterday and where it didn’t. Value area, point of control, high and low volume nodes at a glance.
Overnight Globex — what happened while you were sleeping. Did overnight action respect yesterday’s structure or break it?
GEX Chart — where dealer positioning is concentrated by strike. Where the gamma walls are. Where zero is. The options market’s structural skeleton.
No panels to open. No cognitive surface to engage. Just structure.
Market Mode Score
Compression. Expansion. Transition. The strategy that works in compression destroys you in expansion — not because you executed wrong, but because you brought the wrong playbook. Market Mode Score classifies the regime before you look at a single setup. One number. Every session. Before anything else.
Dealer Gravity
Where price is structurally pulled to settle during the trading day, based on options positioning, gamma concentration, and market structure. Not a prediction — a structural observation. Most traders get stopped out at levels that look like resistance but are actually dealer positioning. Dealer Gravity shows you the difference before you place the trade.
Liquidity Intent Map
Frames directional bias against liquidity conditions. Where mean reversion is likely. Where false breakouts are setting up. Where air-pocket risk is elevated. The traders who get trapped in false moves didn’t have this.
VIX Playbook
Identifies the volatility regime. High VIX and low VIX require completely different approaches. Forcing a low-volatility strategy into a high-volatility environment doesn’t reduce your edge — it reverses it. The VIX Playbook tells you which environment you’re in so you trade the right playbook.
GEX + Volume Profile
Gamma exposure mapped against real volume structure. Where GEX and Volume Profile converge, you have structural support — the kind that holds because the market’s architecture demands it. Where they diverge, you have a manufactured level — the kind that fails when dealers finish hedging.
Knowing the difference before you place the trade changes every decision you make about entries, exits, and sizing.
Convexity Heatmap
Multi-DTE heatmap — 0DTE butterfly, verticals, and singles across all expirations. Where the color is densest is where asymmetric opportunity is building, priced from the real options surface.
An experienced eye spots the right trade in seconds. Click the tile — the template loads directly in TOS. No manual entry. No fat fingers. No gap between what you see and what you execute.
Risk Graph
See your position as a structure, not a bet. Dual P&L curves — at expiration and real-time — on the same chart. Delta, Gamma, Theta, Vega, max profit, max loss, breakevens. Computed from canonical engines, not approximations.
GEX and Volume Profile overlay built in. Your risk curve sits directly on top of structural support and resistance. You see not just what your position does, but where the structure will fight it or support it.
What-If Simulator — drag a slider and see what your position looks like two hours from now, at vol crush, at +1% spot move, at expiration. Scenario presets for the moves that actually happen on 0DTE.
Visual Strategy Overlays — your exit rules become lines on the chart. A profit target and a stop loss render as horizontal lines across the P&L curve. Your plan is visible geometry.
Playbook Rule Matching — when your open position matches a rule in your Playbook, the chart surfaces it. The rule you wrote is active, not archived.
Position Builder
Construct any multi-leg options structure. The builder resolves topology — butterfly, vertical, iron condor — automatically from your legs. One object flows from builder through chart through broker. Nothing gets lost in translation.
Analyze before you commit — send any structure to the Risk Graph without placing an order. See the full P&L curve, Greeks, and scenarios before you decide whether to execute. Cost preview shows commission, fees, and net debit before you confirm. No surprises at fill.
Simulated and live execution. Same flow, same confirmation screen, same fill feedback whether you’re paper trading or going live. Real-time fill updates — order submitted, order filled, position open — streamed live.
Routine
The single biggest edge most traders leave on the table isn’t a tool — it’s consistency.
Readiness Check-In — before you trade, log how you feel. Sleep, focus, mental state — tagged with your own vocabulary. Voluntary, immutable, correlatable with everything else over time. The market has no memory of your last trade. You should.
State of the Market — Convexity Temperature, Market Mode, GEX Regime, LFI Score. The structural picture, every morning, before the bell.
Convexity Temperature — Cool, Warm, or Hot. Tells you what kind of day the structure supports. Not what to trade. What environment you’re stepping into.
TradeLog
Every trade logged, tagged, and searchable. Symbol, strategy, entry, exit, P&L — all in one place. Import from TOS or add manually. Your trading history stops being a memory and becomes a data set. Patterns that were invisible become obvious. The leaks that cost you the most are the ones you didn’t know existed.
Journal
Everything that happened, everything you thought about it, on one page. Each day is a page. Write what you noticed, decided, avoided, felt. Your words, your vocabulary, your record.
Interleaved timeline — journal entries and trade records on the same chronological timeline, grouped by trading session. Morning entries and morning trades together. No switching between views. Trading session dividers: Pre-Market, Morning, Early Afternoon, Power Hour, Globex.
Readiness Check-In appears on the journal day. Your fills appear with structure label and P&L — the Journal reads from the TradeLog, never duplicates data. Tag vocabulary shared across Journal, Playbook, Trades, and Reflections. Name your patterns. The system never creates tags for you.
Attachments — screenshots, charts, documents. Capture what the chart looked like when you made the decision. Calendar view across weeks and months. Year, Month, Week, Day.
Playbook
Where patterns become principles. The Journal is “what happened on February 28th.” The Playbook is “what to do when compression holds at POC with gradient above 2.0.” Completely different organizational logic.
Three-part rule structure: Condition (when it applies), Rule (what to do), Reason (why, from your experience). Every word is yours. Not a system-imposed rulebook.
Journal → Playbook pipeline. Flag a journal entry and it becomes raw material for a Playbook rule. Link journal entries as evidence. Watch a rule strengthen over time as the evidence accumulates.
Risk Graph integration — when you have a position open that matches a Playbook rule’s conditions, the Risk Graph tells you. Your rules are active, not archived.
Performance Report + Review
Win rate tells you almost nothing. A 47.5% win rate with a 1.73 win-to-loss ratio and a Sharpe of 3.09 is a completely different business than a 65% win rate with a 0.8 ratio.
Net profit. Profit factor. Win rate. Average win vs average loss. Max drawdown. Sharpe ratio. Not a scorecard — a diagnostic. The system shows you exactly where your edge is compounding and exactly where it’s leaking.
Your equity curve. Your drawdown. Your return distribution. Visualized across every session — 1 month, 3 months, all time. A right-skewed distribution with a fat tail isn’t luck. That’s the convexity doctrine working.
Vexy — Cognitive Interface
Not a chatbot. A reasoning partner that operates under strict constraints. Vexy cannot tell you what to do. Cannot predict direction. Cannot size positions. Cannot generate signals. That constraint is architectural, not a preference.
She knows what’s on your Risk Graph, what’s in your Journal, which Playbook rules are active, and what your readiness state is. Every conversation is grounded in your actual work — not generic prompts. A conversation at 9:45 AM in the Morning session is structurally different from one at 3:30 PM in Power Hour. She knows the difference.
She helps you write journal entries and Playbook rules through guided interviews. You answer questions about what happened. She assembles the draft. You edit and approve. The writing is always yours.
The longer you trade with her, the sharper the questions get — until you don’t need her to ask them anymore. That’s the goal. That’s the whole point. Full Vexy access at every tier.
Bust — Structural Nudges
The system notices something. It surfaces it once. You decide what to do with it.
System-initiated structural observation — not a notification, not an alert, not a recommendation. Governed by the same constraints as Vexy. Bust cannot tell you to act. It can only show you what it noticed. Single observation, delivered once, then silent.
Alerts
Threshold Alerts — P&L targets, max risk, debit targets, delta and gamma exposure levels. Set them on your positions. The system watches.
Algo Alerts — machine-generated from structural scanners. Convexity opportunity detected, order pending too long, position expiry approaching.
Playbook-Driven Alerts — your Playbook rules can generate alerts. When conditions match, the chart shows it and the alert fires. Profit targets and stop losses are lines on the P&L curve. Alerts don’t just notify — they were always visible.
Accounts + Brokerage
Simulated Account — full trading experience with simulated capital. Engine-backed fills, realistic commission and slippage. Build the practice before the stakes are real.
Live Broker Connection — Tradier integration. Same interface, same flow, real execution.
Provenance Badges — every position on every chart is labeled REAL or SIM. You never confuse a paper position with a live one. Journal and Playbook span all accounts. Trades belong to specific accounts with real/simulated provenance tracking.
Coaching with Ernie
Observer + Activator — Friday coaching call at 9:30 AM ET. One session a week with the trader who built the platform. Reviewing the week’s structure, the decisions that held up, the ones that didn’t.
Navigator — the room. Monday through Friday at 11 AM ET. Sunday retrospective at 9 PM ET. Ask Ernie directly on Discord. Same platform. Same data. Same decisions. In real time, every session. This is not instruction for beginners. It is live execution alongside a trader who has been doing this for thirty years and built these tools because nothing else was good enough.
What This Platform Does Not Do
Does not tell you what to trade. Does not predict price direction. Does not size positions for you. Does not generate trade signals. Does not track streaks, award badges, or gamify your practice. Does not compare you to other traders. Does not manufacture urgency.
The system develops your capacity. You make the decisions. The risk is yours.
This is not a signal service.
Start Observer — $17/week →Four weeks. Full access. Either it changes how you read the market or it doesn’t. That’s the only evaluation that matters.