


Gamma exposure is the single most important piece of market structure data that most traders have never heard of. It tells you whether the market is set up to suppress price moves or amplify them — before the move happens.
Every trading session, market makers hold enormous options positions. Those positions force them to hedge. The direction and magnitude of that hedging is determined by their aggregate gamma. When you understand this dynamic, you stop reacting to price moves and start anticipating them.
This guide explains what gamma exposure is, how to read a GEX chart, what it means in options trading, and how structural traders use this data to position with an edge on SPX 0DTE contracts.
What Is Gamma Exposure?
Gamma exposure — often abbreviated as GEX — measures the total gamma that market makers (dealers) hold across all options strikes at a given price level. In plain terms, it tells you how much dealers will need to buy or sell the underlying to hedge their positions as price moves.
Think of it this way: when you buy a call option, the market maker who sold it to you now has risk. To manage that risk, they delta hedge — buying shares (or futures) to offset the directional exposure your option creates. As price moves, their hedge needs to change. Gamma is the rate at which that hedge changes.
Gamma exposure aggregates this across every open options contract at every strike price. The result is a map of where dealer hedging pressure will push price — and where it will pull price back.
This is not a technical indicator derived from price. GEX is derived from the actual options positioning of market participants. It measures the structure of the market itself.
How Gamma Exposure Moves the Market
Dealer hedging is not optional. It is mechanical. When dealers hold significant gamma, they must hedge — and that hedging moves price.
The mechanism works like this:
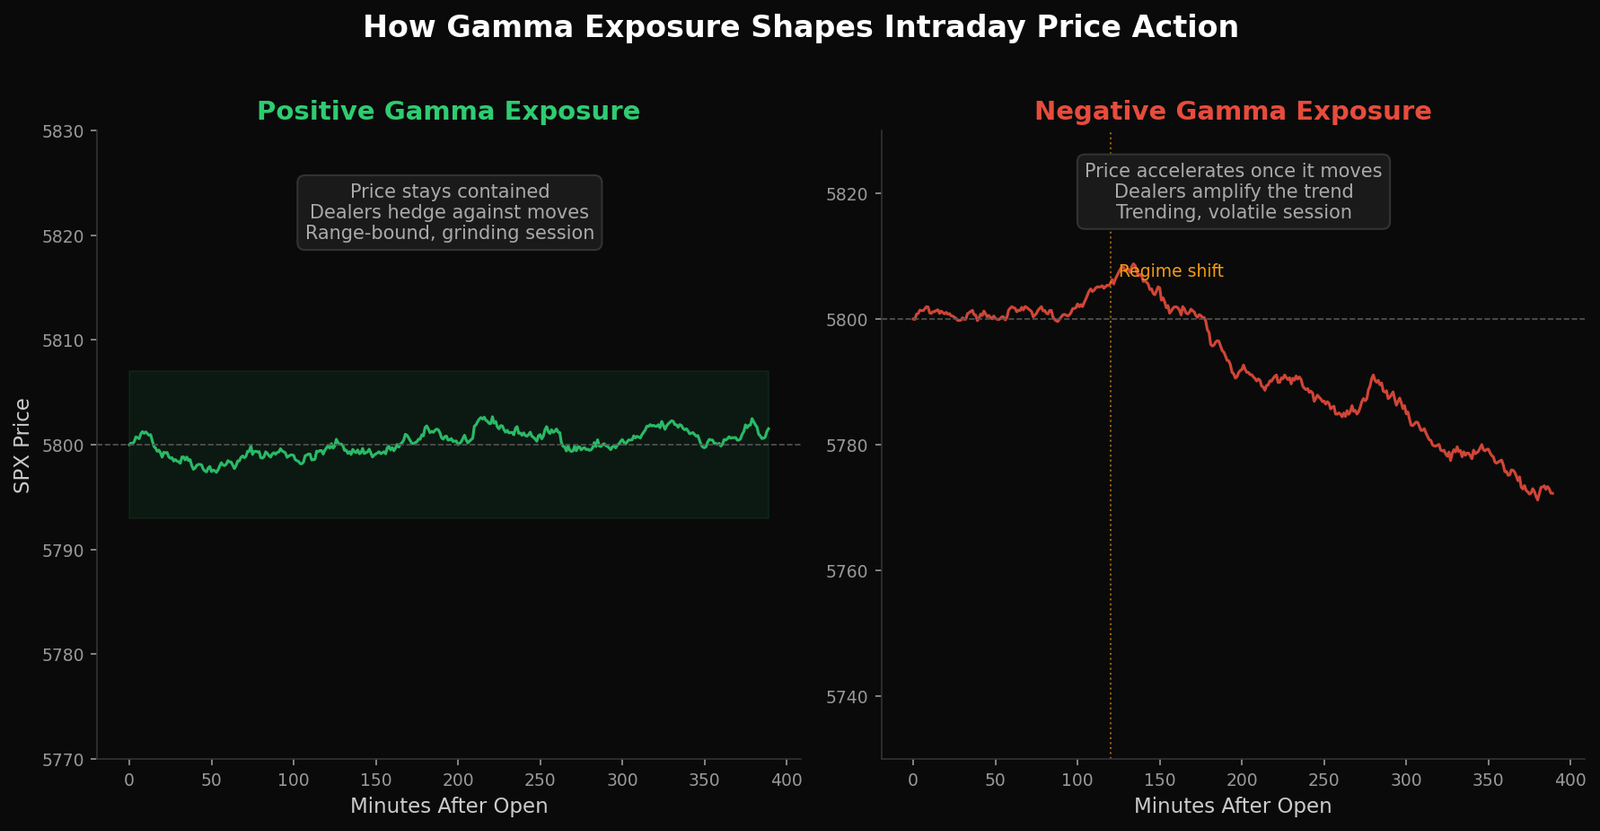
When dealers are long gamma (positive GEX): If price rises, dealers are forced to sell into the move to stay hedged. If price falls, dealers are forced to buy. This creates a natural dampening effect — every move is met with an opposing force. The result is a range-bound, mean-reverting session where price grinds within a narrow band.
When dealers are short gamma (negative GEX): The hedging works in the opposite direction. If price rises, dealers must buy more to hedge — pushing price higher. If price falls, dealers must sell — pushing price lower. Dealer hedging amplifies the move instead of dampening it. The result is a trending, volatile session where price accelerates once it starts moving.
This is not theoretical. It is the mechanical consequence of how options market making works. Dealers do not choose to dampen or amplify. Their positioning forces them to.
Reading a Gamma Exposure Chart
A GEX chart plots the aggregate dealer gamma at each strike price. Understanding how to read this chart is what separates structural traders from everyone else.
The key elements:
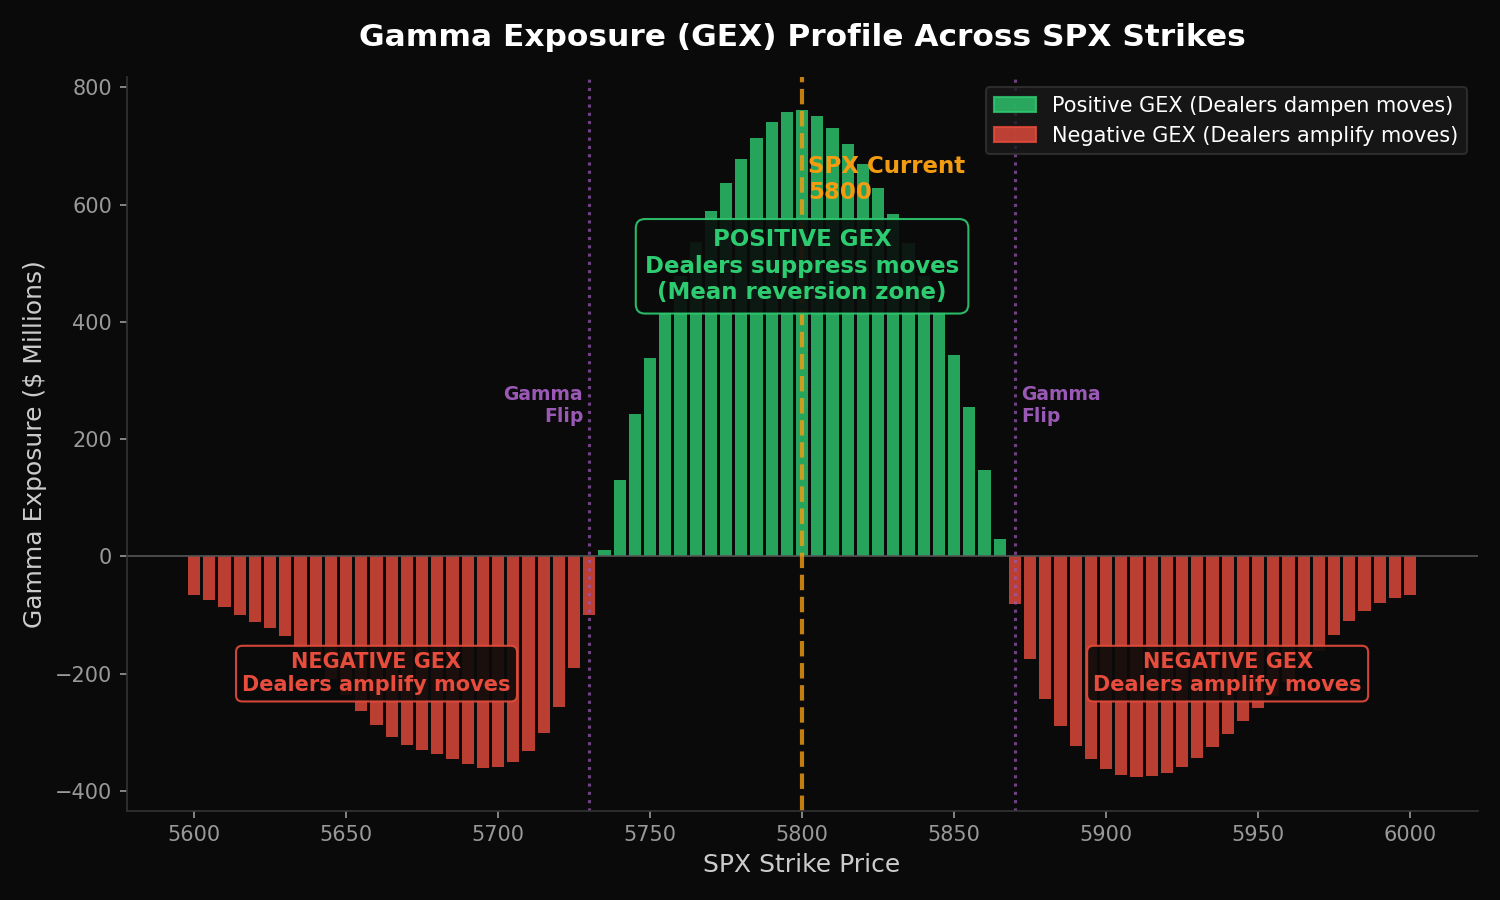
The GEX profile shape. A typical chart shows a bell-shaped curve centered near the current price. The peak represents the strike with the highest concentration of open interest and dealer gamma. Positive bars (above zero) indicate strikes where dealers are long gamma. Negative bars (below zero) indicate strikes where dealers are short gamma.
The gamma flip level. This is the price at which aggregate GEX crosses from positive to negative. Above the flip level, dealers suppress moves. Below it, dealers amplify moves. The gamma flip is arguably the most important level on any gamma exposure chart — it tells you the boundary between a contained market and an explosive one.
The magnitude. Not all positive GEX environments are equal. A reading of +$5 billion on SPX creates far more suppression than +$500 million. The absolute size determines the strength of the dampening or amplifying effect.
Strike clustering. Large GEX concentrated at a single strike (like a round number — 5800, 5900) creates a magnetic effect. Price tends to gravitate toward high-GEX strikes and accelerate through low-GEX zones. This is why SPX often pins near high-volume strikes on expiration — the concentrated dealer positioning at those strikes pulls price toward them.
SPX Gamma Exposure vs SPY Gamma Exposure
Both SPX and SPY have measurable gamma exposure, but they behave differently in ways that matter for trade construction.
SPX gamma exposure is driven primarily by institutional and dealer positioning. SPX options are cash-settled, European-style, and carry Section 1256 tax treatment. The options market on SPX is enormous — billions of dollars in notional gamma exposure shift every session. SPX gamma exposure data is the primary signal for structural 0DTE trading because it reflects where the largest hedging flows will occur.
SPY gamma exposure is driven by a mix of institutional and retail positioning. SPY options are American-style and physically settled, which introduces assignment dynamics that do not exist on SPX. SPY gamma exposure tends to be smaller in absolute terms (roughly 1/10th of SPX by notional value) and noisier due to the retail component.
For same-day expiration trading, SPX gamma exposure is the authoritative signal. SPY gamma exposure is useful as a confirmation tool but should not be the primary structural read. The dealer hedging flows that shape intraday price action are overwhelmingly concentrated in SPX options.
Gamma Exposure and 0DTE Trading
Gamma exposure matters on every timeframe, but it matters most on 0DTE contracts — and the reason is mathematical.
On the final day of an option’s life, gamma reaches its peak. An at-the-money option with one day to expiration has dramatically higher gamma than the same option with thirty days to expiration. This means that dealer hedging activity is at its most intense on expiration day.
For 0DTE traders, this creates two distinct session types:
Positive gamma exposure sessions. When aggregate GEX is positive, the market is in suppression mode. Price moves are dampened. Mean reversion is the dominant dynamic. Butterfly spreads placed near the expected value zone have the highest probability of profit in this environment because price tends to consolidate rather than trend.
Negative gamma exposure sessions. When aggregate GEX is negative — or when price drops below the gamma flip level — the market enters amplification mode. Moves extend. Trends persist. This is where the iron condor fails catastrophically and where directional butterflies or wider structures capture asymmetric payoffs.
Reading the gamma exposure regime before the open is not optional for 0DTE trading. It is the first decision of the session. Your strategy selection, strike placement, width, and position size all depend on whether dealers are set up to suppress or amplify.
What Is GEX in Options Trading?
GEX stands for Gamma Exposure Index. It is a single number that represents the aggregate gamma exposure of all market makers across all strikes and expirations for a given underlying — typically SPX or SPY.
The GEX calculation works like this:
- For each strike: multiply the open interest by the gamma of the option at that strike, by 100 (the contract multiplier), by the spot price.
- Call gamma is positive (dealers who sold calls are long gamma when hedging).
- Put gamma is negative (dealers who sold puts are short gamma when hedging).
- Sum across all strikes to get the net gamma exposure at the current price level.
The resulting number — expressed in dollars — tells you how many dollars worth of the underlying dealers must trade for each 1-point move in the index. A GEX of +$5 billion means that for every 1-point rise in SPX, dealers must sell approximately $5 billion worth of SPX futures to stay hedged. That selling pressure suppresses the move.
A negative GEX means dealers must buy as price rises and sell as price falls — amplifying the move in both directions.
The GEX value changes throughout the day as options are traded, exercised, and expire. This is why gamma exposure is a dynamic signal, not a static one. The gamma exposure reading at 9:30 AM may be different from the reading at 2:00 PM, especially on a day with heavy options volume.
Positive vs Negative Gamma Exposure Regimes
Understanding the two gamma exposure regimes is the foundation of structural trading. Each regime produces a fundamentally different market environment.
Positive gamma exposure (long gamma environment):
- Dealers hedge against price moves — buying dips, selling rips
- Intraday range is compressed
- Price tends to revert to high-GEX strikes
- Volatility contracts throughout the session
- Butterfly spreads and mean-reversion strategies thrive
- Iron condors have their best chance (though the risk-reward is still adverse)
Negative gamma exposure (short gamma environment):
- Dealers hedge with the move — buying as price rises, selling as price falls
- Intraday range expands
- Price accelerates through low-GEX zones
- Volatility expands, sometimes sharply
- Directional butterflies and wider structures capture asymmetric moves
- Premium-selling strategies face their worst conditions
The gamma flip level is where the regime changes. If SPX opens above the gamma flip, dealers are in positive gamma territory. If price drops below the flip level during the session, the regime shifts — and the character of the market changes in real time.
This is why the gamma flip is watched so closely by structural traders. It is not a support or resistance level in the traditional sense. It is a behavioral boundary that determines whether the market suppresses moves or amplifies them.
How to Use Gamma Exposure in Your Trading
Gamma exposure is not a trade signal. It is a regime filter that determines which strategies have a structural edge for the current session.
The practical application follows a consistent process:
Before the open: Check the aggregate gamma exposure reading and the gamma flip level. Determine whether the session opens in a positive or negative gamma environment. This sets the baseline for everything that follows.
Strategy selection: In positive gamma exposure environments, narrower butterflies placed near the expected value zone are favored. In negative gamma environments, wider structures or directional butterflies positioned for a trending move are favored. Premium-selling strategies should be avoided in negative gamma regimes entirely.
Strike placement: High-GEX strikes act as magnets for price. Low-GEX zones are highways that price moves through quickly. Place butterfly bodies near high-GEX strikes. Avoid placing short strikes in low-GEX zones where price can accelerate through without resistance.
Position sizing: Negative gamma environments produce larger intraday ranges. Position size should be reduced in negative gamma sessions to account for the increased volatility. Positive gamma environments allow normal sizing because the range compression limits adverse movement.
Intraday monitoring: If price approaches or crosses the gamma flip level, the regime is shifting. A session that started in positive gamma territory can shift to negative gamma territory if price drops below the flip. When this happens, the session character changes — and your trade management should change with it.
At Fly on the Wall, gamma exposure data is surfaced through the GEX overlay and Dealer Gravity tools. These show the gamma exposure profile, flip levels, and high-GEX magnet strikes in real time — so you can read the structural environment before making a single trade decision.
Frequently Asked Questions
What is gamma exposure in options trading?
Gamma exposure measures the total gamma that market makers hold across all options strikes. It tells you how much dealers must buy or sell the underlying to hedge their positions as price moves. Positive gamma exposure means dealers suppress price moves through counter-directional hedging. Negative gamma exposure means dealers amplify price moves through same-directional hedging.
What is GEX in the stock market?
GEX stands for Gamma Exposure Index. It is a single number representing the aggregate dealer gamma across all options strikes and expirations for an underlying like SPX or SPY. A positive GEX indicates a mean-reverting, range-bound environment. A negative GEX indicates a trending, volatile environment. GEX is expressed in dollars and changes throughout the trading session as options are traded.
What is GEX in options trading?
In options trading, GEX tells you the hedging pressure that market makers will exert at different price levels. For every 1-point move in the index, dealers must trade a dollar amount equal to the GEX value to maintain their hedges. High positive GEX means heavy suppression of price moves. Negative GEX means dealer hedging will accelerate price moves in both directions.
How does gamma exposure affect SPX price?
When SPX gamma exposure is positive, dealer hedging creates a dampening effect — buying dips and selling rips — which produces range-bound, grinding sessions. When gamma exposure is negative, the hedging flips direction and amplifies moves, producing trending sessions with larger intraday ranges. The gamma flip level marks the boundary between these two regimes.
How do you use gamma exposure for 0DTE trading?
Check the aggregate gamma exposure and gamma flip level before the open. In positive gamma environments, use narrower butterfly spreads placed near high-GEX magnet strikes. In negative gamma environments, use wider directional structures positioned for trending moves. Avoid premium-selling strategies like iron condors in negative gamma regimes. Monitor for gamma flip crossings intraday — they signal a regime change.
See the Gamma Exposure Your Broker Cannot Show You
Most trading platforms show you price, volume, and maybe a few indicators derived from historical data. None of them show you gamma exposure — the structural force that determines whether today’s market will grind or trend before the session even begins.
Fly on the Wall was built to surface this structural picture in real time. The GEX overlay shows dealer gamma exposure across every strike. Dealer Gravity shows where hedging pressure pulls price. The Market Mode Score integrates gamma exposure with VIX regime and volume profile for a complete structural read.
Start with the Observer for daily structural analysis and the tools that show you where the market is positioned before the open. Step up to Activator for full execution tools, real-time GEX overlay, and weekly coaching. Or go all-in with Navigator for daily direct coaching with Ernie. Compare all plans here.