


The expected move is the single most practical number in options trading. It tells you how far the market is pricing a stock or index to move during a specific time period — before the move happens. For traders who use this number, strike selection stops being a guess and starts being a structural decision.
Every option price contains an implied forecast of future movement. The expected move extracts that forecast into a simple range: the upper and lower price levels where the market expects the underlying to trade with approximately 68% probability. This is not a prediction. It is the market’s own pricing of uncertainty — derived from the collective positioning of every options participant.
This guide explains what the expected move is, how to calculate it, how to read it for SPX and SPY, and how structural traders use it to place butterfly spreads with precision on 0DTE contracts.
What Is the Expected Move in Options?
The expected move in options is a statistical estimate of how far the underlying asset is likely to move within a given time frame. It is derived from the price of at-the-money options — specifically from implied volatility.
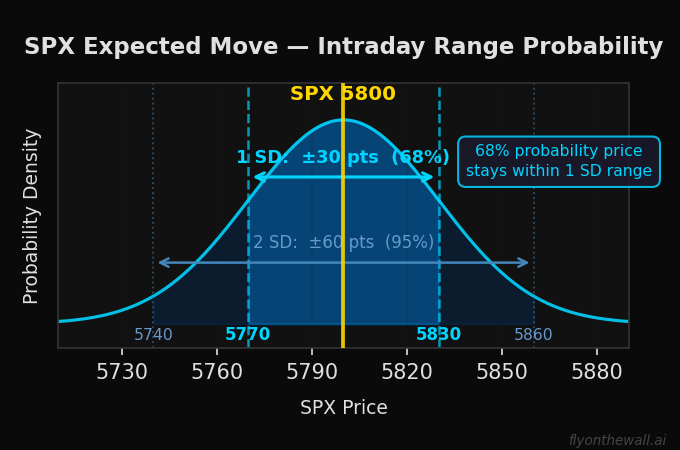
In plain terms: if the expected move on SPX is ±30 points for today’s session, the options market is pricing a 68% chance that SPX will close within 30 points of its opening price. That means a range of roughly 5770 to 5830 if SPX opens at 5800.
The expected move is not a guarantee. It is not a support or resistance level. It is the market’s consensus estimate of probable range — and it is remarkably well-calibrated over large sample sizes. Across hundreds of sessions, SPX settles within the expected move approximately 68% of the time. This statistical reliability is what makes it useful for trade construction.
The concept comes directly from options pricing theory. The price of an at-the-money straddle (a call and a put at the same strike) represents the market’s estimate of total movement. The expected move is simply that straddle price translated into points of underlying movement.
How to Calculate the Expected Move
The expected move formula is straightforward. There are two common methods, and both produce similar results.
Method 1 — From the ATM straddle price:
The fastest way to calculate the expected move is to take the price of the at-the-money straddle and multiply by 0.85:
Expected Move = ATM Straddle Price × 0.85
If the SPX 5800 straddle (the 5800 call + the 5800 put) is trading at $35.00, the expected move is:
$35.00 × 0.85 = ±$29.75 (approximately ±30 points)
The 0.85 multiplier adjusts for the fact that the straddle slightly overestimates the one-standard-deviation move. This is a trader’s shortcut that works well in practice.
Method 2 — From implied volatility:
For a more precise calculation, use implied volatility directly:
Expected Move = Spot Price × IV × √(DTE / 365)
For a same-day expiration on SPX at 5800 with 16% annualized implied volatility:
5800 × 0.16 × √(1/365) = 5800 × 0.16 × 0.0523 = ±48.5 points
For intraday use on 0DTE, many traders substitute the number of trading hours remaining rather than calendar days, which produces a tighter expected move that better reflects the actual session range.
Both methods give you the one-standard-deviation expected move — the range within which price will settle approximately 68% of the time. Double it for the two-standard-deviation range (approximately 95% probability).
Expected Move vs Actual Move — What the Data Shows
The expected move is derived from implied volatility, which tends to overstate actual realized volatility. This persistent gap between expected and actual moves has direct implications for how you trade.
In low-volatility environments (VIX below 17): The expected move frequently overstates the actual range. SPX settles within the expected move 70% to 75% of sessions — more often than the theoretical 68%. This overshoot creates a structural advantage for strategies that profit from price staying in a range, like centered butterfly spreads.
In high-volatility environments (VIX above 25): The expected move becomes less reliable. SPX breaches the expected move more frequently — sometimes dramatically. Implied volatility rises to account for uncertainty, but tail events still exceed the priced-in range more often than the normal distribution predicts. This is where the expected move becomes a baseline, not a boundary.
The practical takeaway: Use the expected move as a structural anchor, not a guarantee. In calm markets, trust it more. In volatile markets, widen your expectations. Never treat the expected move boundary as a hard wall — price can and will exceed it, especially in negative gamma exposure environments where dealer hedging amplifies moves.
How to Use the Expected Move for Strike Selection
The expected move transforms strike selection from guesswork into a structural process. Instead of picking strikes based on gut feeling or chart patterns, you use the market’s own pricing of probability to determine where to position your trades.
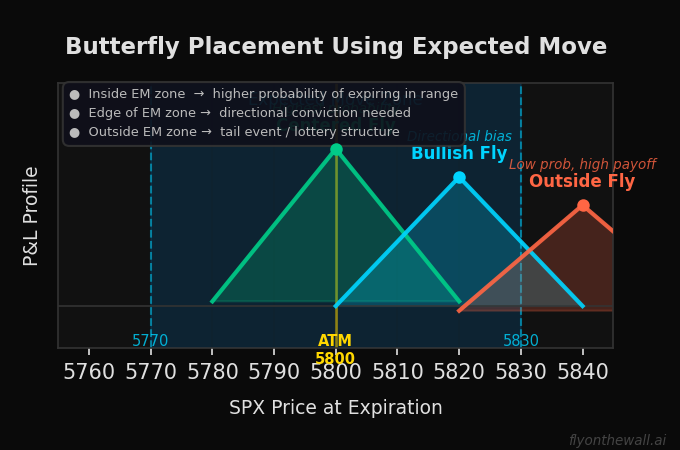
For butterfly spreads: The body of your butterfly — where you place the short strikes — should align with the expected value zone derived from the expected move. A centered butterfly with its body at the current price inside the expected move range has the highest probability of profit. A directional butterfly with its body near the edge of the expected move captures trending scenarios while maintaining favorable probability.
For credit spreads and iron condors: If you sell premium, the expected move tells you where the market expects the boundaries to be. Selling strikes inside the expected move is fighting probability — the market already prices a 68% chance of reaching those levels. This is precisely why iron condors with strikes too close to the current price fail at an unsustainable rate on 0DTE contracts.
For directional trades: The expected move gives you a reality check. If you are buying a call with a strike 50 points above the current price and the expected move is only 30 points, the market is telling you that your trade requires a greater-than-one-standard-deviation event to profit. That does not mean the trade is wrong — but it means you should size it accordingly and not expect it to work most of the time.
SPX Expected Move vs SPY Expected Move
Both SPX and SPY have calculable expected moves, but they behave differently in ways that matter for execution.
The SPX expected move is derived from the most liquid institutional options market in the world. SPX options are cash-settled, European-style, and carry enormous open interest at key strikes. The expected move on SPX reflects deep institutional positioning and is tightly calibrated to actual realized moves. For 0DTE trading, SPX expected move is the authoritative signal.
The SPY expected move is derived from a mix of institutional and retail positioning. SPY trades at approximately 1/10th of SPX’s price, so the absolute expected move is proportionally smaller. SPY options are American-style and physically settled, which introduces exercise dynamics that do not exist on SPX. The SPY expected move is useful as a confirmation tool but should not be the primary reference for structural trade placement.
For same-day expiration trading, always anchor your strike selection to the SPX expected move. Use SPY expected move as a secondary check if you trade SPY options.
The Expected Move on 0DTE Contracts
The expected move matters most on same-day expiration contracts because gamma is at its peak and the session’s range will be determined in hours, not weeks.
On a 0DTE session, the expected move provides three critical inputs:
1. Width selection for butterflies. The expected move tells you how wide to make your butterfly. In a low-expected-move session (tight range anticipated), narrower butterflies concentrate your position in the most probable zone. In a high-expected-move session, wider butterflies give room for larger price swings. This aligns directly with the VIX regime width selection — the expected move is the numerical expression of the same concept.
2. Body placement. Place the body of your butterfly inside the expected move range for highest probability. Place it at the edge for a directional trade. Place it outside for a low-probability, high-payoff position. The expected move gives you the map — you decide where on the map to position.
3. Risk calibration. If the expected move is 25 points and you are risking a $60 butterfly, that is appropriate. If the expected move is 60 points and you are still risking the same butterfly, your position is likely too narrow and needs to be widened — or you need to reduce size to account for the increased range.
The expected move updates throughout the session as options are traded and implied volatility shifts. Check it before the open, but also monitor it intraday. A sudden expansion in the expected move — driven by a VIX spike or a gamma flip — signals that the structural environment has changed and your trade plan may need to adapt.
Expected Move and VIX — The Connection
VIX is the annualized expected move of the S&P 500. That is all it is.
A VIX of 16 means the options market expects the S&P 500 to move approximately 16% over the next year. To convert that to a daily expected move:
Daily Expected Move = (VIX / 100) × SPX Price / √252
At VIX 16 with SPX at 5800:
(0.16 × 5800) / √252 = 928 / 15.87 = ±58.5 points
This is the one-standard-deviation daily expected move. For an intraday 0DTE session (roughly 6.5 trading hours), the expected move is smaller — typically 60% to 70% of the full-day figure.
Understanding this connection is important because VIX regimes directly determine the character of the expected move:
- VIX below 17 (Zombieland): Expected moves are compressed. Narrow butterflies thrive. Sessions are grinding and range-bound.
- VIX 17-24 (Goldilocks): Expected moves are moderate. The sweet spot for 0DTE butterfly trading — enough movement to create opportunity without excessive range.
- VIX 24-32 (Elevated): Expected moves expand significantly. Wider structures needed. Position size should decrease.
- VIX above 32 (Chaos): Expected moves are large and unreliable. The distribution becomes fat-tailed — moves exceeding two standard deviations happen more frequently than the model predicts.
Common Expected Move Mistakes
Treating the expected move as support and resistance. The expected move boundaries are probability zones, not price levels that will hold. Price does not bounce off the expected move. There is no mechanical force that prevents SPX from exceeding it. Do not place trades that depend on the expected move boundary holding like a wall.
Using the wrong time frame. The annualized expected move, the daily expected move, and the intraday expected move are different numbers. Using the daily expected move for a trade that expires in 3 hours will dramatically overstate the anticipated range. Match the expected move time frame to your trade duration.
Ignoring regime shifts. The expected move calculated at 9:30 AM may not reflect the environment at 1:00 PM. An economic release, a VIX spike, or a gamma exposure flip can expand the expected move mid-session. If you placed a narrow butterfly based on the morning’s expected move and the environment has shifted to trending mode, the original thesis may no longer apply.
Confusing expected move with edge. The expected move tells you where price is likely to land. It does not tell you whether your trade has a positive expected value. A butterfly placed at the center of the expected move has high probability but may still have negative expected value if the debit is too large relative to the maximum return. The expected move is an input to your process — not the process itself.
Not adjusting for skew. The expected move is symmetric — ±30 points in either direction. But real market distributions are not symmetric. Downside moves tend to be faster and larger than upside moves, especially on SPX. In practice, the downside expected move should be treated as slightly wider than the upside. This matters for butterfly placement — a centered butterfly may benefit from a slight upward bias to account for downside skew.
Frequently Asked Questions
What is the expected move in options trading?
The expected move is the range that the options market prices the underlying to trade within during a specific time period. It represents approximately one standard deviation of expected price movement — a 68% probability zone. It is calculated from the at-the-money straddle price or from implied volatility and tells traders how far price is likely to move before it actually moves.
How do you calculate the expected move?
The fastest method is to multiply the at-the-money straddle price by 0.85. For SPX with a 5800 straddle at $35, the expected move is $35 × 0.85 = ±30 points. The precise method uses the formula: Spot Price × Implied Volatility × √(DTE/365). Both methods give the one-standard-deviation expected move that contains approximately 68% of probable outcomes.
How accurate is the expected move?
Across large sample sizes, the expected move is well-calibrated. SPX settles within the expected move approximately 68% to 75% of sessions in low-volatility environments. In high-volatility environments, actual moves exceed the expected move more frequently. Implied volatility tends to overstate realized volatility on average, which means the expected move range is slightly wider than what actually occurs in most sessions.
How do you use expected move for 0DTE trading?
The expected move provides three inputs for 0DTE trading: butterfly width selection (match width to expected range), body placement (center the body inside the expected move for highest probability), and risk calibration (ensure position sizing accounts for the anticipated range). Check the expected move before the open and monitor it intraday for regime shifts.
What is the difference between expected move and implied volatility?
Implied volatility is an annualized percentage that represents the market’s forecast of future price movement. The expected move is the translation of implied volatility into actual price points for a specific time frame. A VIX of 16 means 16% annualized implied volatility, which translates to a daily SPX expected move of approximately ±58 points. They measure the same thing — the expected move just makes it actionable for trade construction.
Trade Inside the Expected Move — Not Against It
The expected move is not a signal. It is a structural framework that tells you where the market expects price to be — and how certain it is about that expectation. Traders who use this number position their butterflies with precision, calibrate their width to the regime, and size their risk to the environment. Traders who ignore it are guessing.
At Fly on the Wall, the expected move is built into every session’s structural analysis. The expected value zone — where butterflies have the highest probability of profit — is derived directly from the expected move and refined with gamma exposure data and dealer positioning. You do not have to calculate it yourself. The tools surface it before the open.
Start with the Observer for daily structural analysis and the tools that show you the expected move and market positioning before every session. Step up to Activator for full execution tools, real-time GEX overlay, and weekly coaching. Or go all-in with Navigator for daily direct coaching with Ernie. Compare all plans here.