


A gamma squeeze is one of the most powerful — and most misunderstood — forces in modern options markets. It occurs when market makers are forced to buy the underlying asset to hedge their short options positions, and that buying creates more upward pressure, which forces more buying. The result is a self-reinforcing loop that drives price far beyond what fundamentals justify. Every gamma squeeze follows the same mechanical process, and understanding that process is what separates traders who profit from squeezes from those who get destroyed by them.
The term gained mainstream attention during the 2021 meme stock events, but gamma squeezes are not new and they are not rare. They happen on SPX during economic releases. They happen on individual equities after earnings. They happen any time the options market’s hedging flows overwhelm the available liquidity in the underlying. This guide explains the gamma squeeze mechanism in practical terms, shows how dealer positioning creates the conditions for one, and identifies how structural traders use these events rather than fear them.
What Is a Gamma Squeeze?
A gamma squeeze begins with dealer hedging. When a trader buys call options, the market maker who sells those calls is short gamma — meaning as price rises, their exposure increases and they must buy the underlying to stay hedged. That buying pushes price higher, which increases their exposure further, which forces more buying. The feedback loop accelerates until either the buying pressure exhausts itself or the options expire.
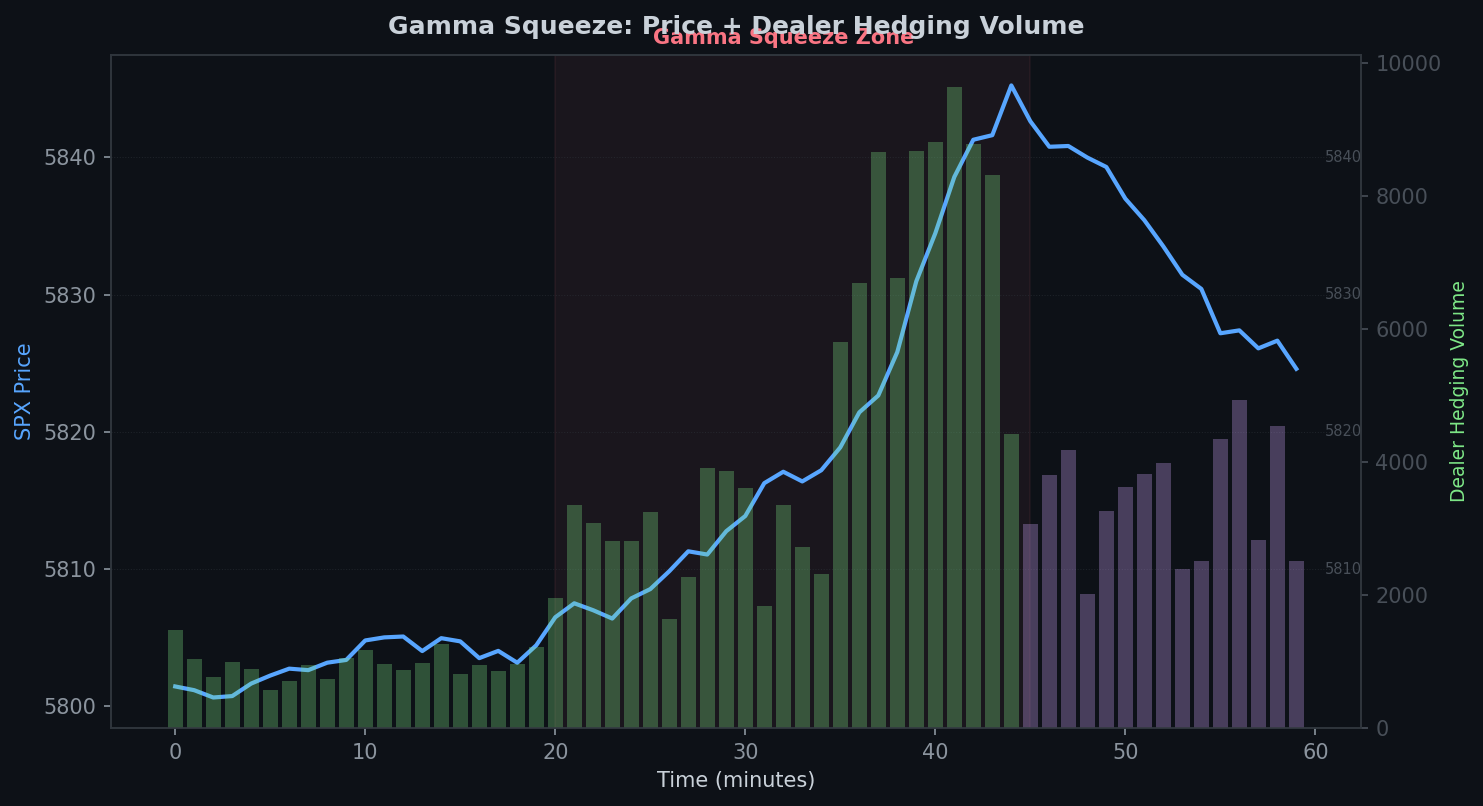
The gamma squeeze mechanism has three phases. First, heavy call buying concentrates open interest at specific strikes. Second, as price approaches those strikes, dealer hedging ramps — this is where the squeeze begins. Third, once price pushes through the concentrated strikes, hedging flows accelerate exponentially and the gamma squeeze enters its most violent phase.
The opposite also exists. A reverse gamma squeeze occurs when dealers are long gamma from put buying and must sell the underlying as price drops — amplifying the decline. The same mechanical process, opposite direction.
How Dealer Hedging Creates the Feedback Loop
To understand why a gamma squeeze happens, you need to understand how market makers manage risk.
Market makers are not directional traders. When they sell you a call option, they immediately hedge by buying shares of the underlying proportional to the option’s delta. If they sell you a call with a delta of 0.30, they buy 30 shares per contract. As price moves higher and delta increases to 0.50, they must buy 20 more shares. If delta reaches 0.80, they buy another 30.
This hedging is mandatory and mechanical. Dealers do not choose whether to hedge. Their risk management systems require it. This means the buying pressure from the squeeze is not speculative — it is structural. It will continue as long as price keeps rising through strikes where dealers are short gamma.
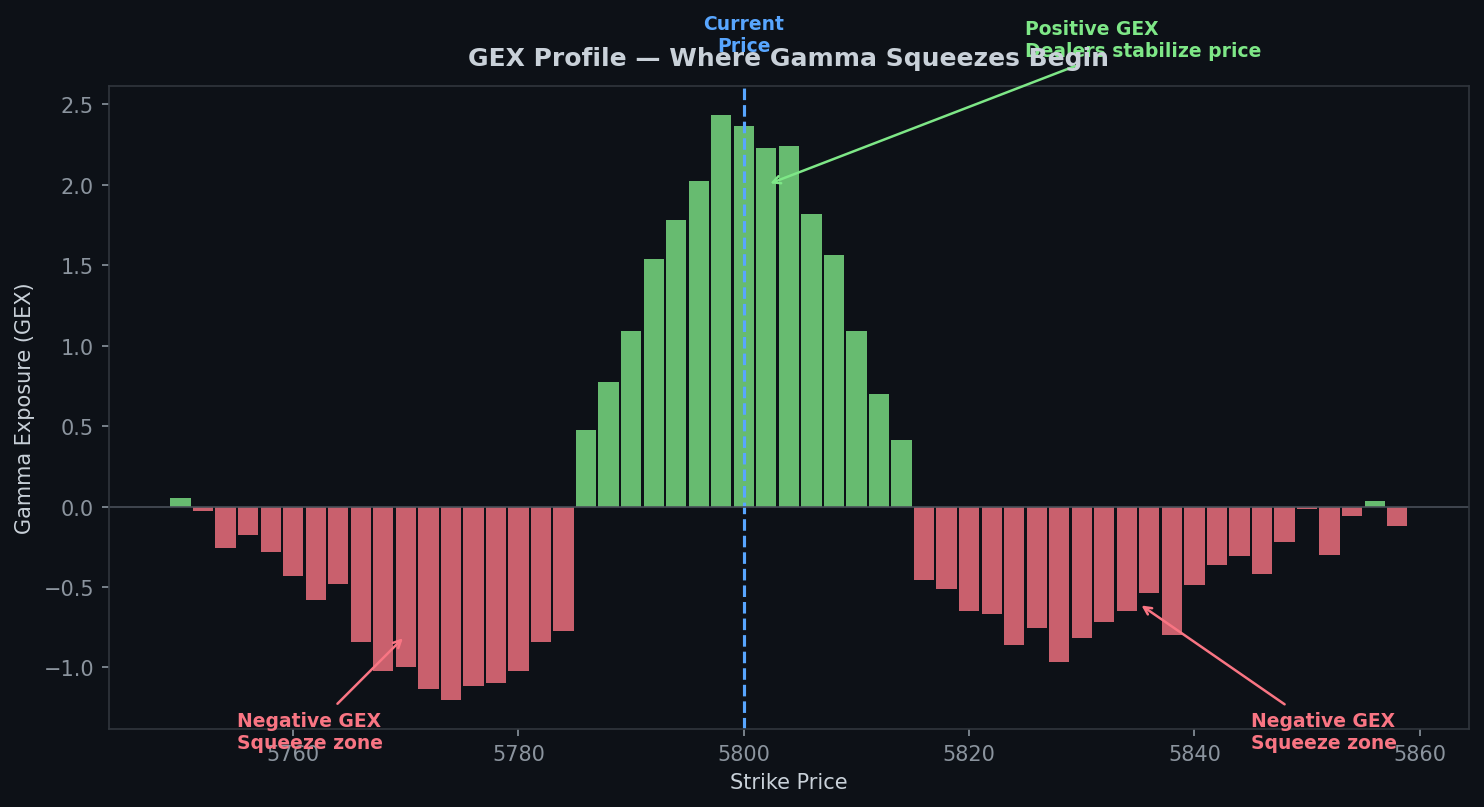
Gamma exposure (GEX) measures this risk across the entire options chain. When aggregate GEX is deeply negative, dealers are positioned in a way that amplifies directional moves. Negative GEX is the precondition for a gamma squeeze. Positive GEX, by contrast, means dealers are hedging in a way that dampens movement — buying dips and selling rallies, which stabilizes price.
Real Examples of Squeeze Mechanics in Action
The gamma squeeze is not theoretical. It has produced some of the largest moves in recent market history.
GameStop (January 2021) was the most visible gamma squeeze. Retail traders bought massive quantities of out-of-the-money calls. Dealers who sold those calls were forced to hedge by buying shares. As the stock rose from $20 to $80, the delta on those calls increased, forcing dealers to buy more. The buying pushed price to $150, then $300, then briefly above $480. Each new high forced more hedging, which pushed price higher, which forced more hedging. The squeeze only ended when brokers restricted buying.
SPX experiences gamma squeezes around economic events. Before FOMC announcements or CPI releases, options positioning often creates the conditions for a squeeze. If traders are heavily positioned in puts (expecting a selloff) and the data comes in positive, the rally forces dealers to buy futures to hedge their short put delta. The resulting buying can produce an SPX move two to three times the expected move — a gamma squeeze compressing an entire week of movement into hours.
Earnings events trigger gamma squeezes on individual stocks. When implied volatility is high before earnings and the stock gaps through strikes with heavy open interest, the dealer hedging flows amplify the initial move. This is why post-earnings moves sometimes exceed even the widest expected move brackets. The fundamental news is the catalyst, but the gamma squeeze is the amplifier.
How to Identify a Gamma Squeeze Before It Happens
A gamma squeeze does not appear without warning. The conditions that create one are visible in the options data before the move begins.
Negative GEX is the primary signal. When gamma exposure across the options chain is negative, dealers will amplify directional moves rather than dampen them. A deeply negative GEX reading — particularly concentrated at specific strike levels — means the market is primed for a gamma squeeze in either direction. The FOTW GEX overlay surfaces this data in real time.
Concentrated open interest at specific strikes creates squeeze targets. If 50,000 call contracts are concentrated at a single strike, that strike becomes a magnet. As price approaches it, delta hedging accelerates. If price pushes through it, the hedging flows become a wave. The strikes with the highest open interest are the pressure points where a gamma squeeze gains momentum.
Low liquidity amplifies the effect. A gamma squeeze is most violent when dealer hedging flows meet thin order books. Pre-market hours, the first 15 minutes after open, and the period around economic releases all feature reduced liquidity — which means the same hedging flow moves price further, triggering more hedging, feeding the squeeze.
Rising short-term implied volatility signals positioning stress. When implied volatility spikes on near-term options while longer-dated options remain stable, it often indicates aggressive directional positioning that could fuel a gamma squeeze if price moves against the crowd.
Why Most Traders Lose During the Squeeze
A gamma squeeze creates the illusion of easy money — prices moving fast and far in one direction. But the mechanics that drive the squeeze are the same mechanics that reverse it.
The squeeze reverses as fast as it builds. Once buying pressure exhausts — because options expire, traders take profit, or new positioning offsets the imbalance — the same dealers who were forced buyers become forced sellers. The unwind of a gamma squeeze can be just as violent as the squeeze itself. Traders who chase the move at the top get caught in the reversal.
Credit spread sellers face the worst outcomes. A short put spread below the market during a downward gamma squeeze reaches maximum loss in minutes. The negative gamma accelerates losses beyond what the small premium collected can offset. This is why selling premium into negative GEX conditions is structurally dangerous — the squeeze is the tail event that credit spreads cannot survive.
The squeeze punishes both directions. Bulls who buy calls at elevated premiums during the squeeze pay inflated implied volatility. When the squeeze ends and IV collapses, those calls lose value even if price stays elevated. Bears who fight the squeeze with short positions face unlimited loss potential against a mechanically driven rally. Neither side has edge without understanding the positioning.
How Structural Traders Use the Gamma Squeeze
The gamma squeeze is not something to fear or chase. It is a market condition to trade around — and structural 0DTE traders have specific tools for it.
Butterfly spreads placed at GEX-identified targets capture the squeeze’s endpoint. If GEX data shows a likely pin level where dealer hedging flows neutralize, a butterfly placed at that level profits from price convergence after the gamma squeeze exhausts. The cost is a small debit — the maximum risk. The potential return is 5x to 25x that debit if price settles near the body.
The VIX regime determines the right structure. In high-volatility regimes where gamma squeezes are more likely, wider butterflies accommodate the larger range. In low-volatility regimes, the conditions for a large squeeze event are reduced and narrower structures suffice. The options Greeks — particularly gamma and theta — determine which structure fits the environment.
Timing matters more than direction during a gamma squeeze. The squeeze creates a temporary dislocation. Once it resolves, price often returns toward the level where GEX turns positive and dealer hedging begins to stabilize. Entering a butterfly after the initial squeeze move — rather than trying to predict the squeeze direction — gives structural traders an edge that directional traders lack.
Frequently Asked Questions
What is a gamma squeeze?
A gamma squeeze is a feedback loop where market maker hedging amplifies price movement. When dealers are short gamma from selling options, rising prices force them to buy the underlying to hedge, which pushes prices higher, which forces more buying. The process accelerates until the positioning imbalance resolves through expiration, profit-taking, or offsetting flows.
What causes a gamma squeeze?
A gamma squeeze is caused by concentrated options positioning that puts dealers on the wrong side of a directional move. Heavy call buying at specific strikes, negative aggregate gamma exposure (GEX), and a catalyst that pushes price toward those strikes are the three ingredients. Low liquidity conditions amplify the effect.
How long does a gamma squeeze last?
A gamma squeeze can last from hours to days depending on the positioning. On 0DTE SPX options, a gamma squeeze typically plays out within a single session — often in one to three hours around an economic release. On equities with weekly or monthly options, a gamma squeeze can persist for several days if the open interest that fuels it does not expire or get closed.
Can you predict a gamma squeeze?
You cannot predict the exact timing or direction of a gamma squeeze, but you can identify the conditions that make one likely. Negative GEX, concentrated open interest at nearby strikes, an upcoming catalyst, and thin liquidity are the preconditions. When all four align, the probability of a gamma squeeze increases significantly.
How do you profit from a gamma squeeze?
Structural traders profit from a gamma squeeze by placing defined-risk butterfly spreads at levels where GEX data indicates price is likely to stabilize after the squeeze resolves. Rather than chasing the directional move, they position for the convergence that follows. The butterfly costs a small debit and returns multiples of that debit if price settles near the target — turning the squeeze from a risk event into an opportunity.
Position for the Squeeze, Do Not Chase It
The gamma squeeze is a structural event driven by dealer mechanics — not news, not sentiment, not technical patterns. It follows predictable rules: negative GEX sets the stage, concentrated open interest marks the pressure points, and a catalyst lights the fuse. Understanding this process transforms the event from chaotic into a readable market condition.
At Fly on the Wall, the GEX overlay shows exactly where dealer positioning creates squeeze risk. The expected move defines the structural range. The VIX regime determines the appropriate width. And the butterfly — placed at the convergence target after the squeeze — captures the resolution without chasing the move.
Start with the Observer for daily structural analysis including GEX positioning and expected move before every session. Step up to Activator for the real-time GEX overlay, full execution tools, and weekly coaching. Or go all-in with Navigator for daily direct coaching with Ernie. Compare all plans here.