


Options order flow is the most misunderstood edge in trading. Every day, billions of dollars in options contracts change hands on SPX alone. Each of those transactions shifts the positioning landscape — the aggregate map of who owes what to whom and how they must hedge. That positioning landscape is what moves price. Not the individual trades. Not the headlines. The flow.
Most traders encounter options order flow through tools that highlight big trades — “$3 million in SPX 5650 calls just swept the ask.” That is not flow analysis. That is a transaction alert. Real flow analysis means understanding how the aggregate positioning of dealers and institutions creates structural pressure on price, and how that pressure resolves during the trading session. This guide explains how to read options order flow at the level that matters — the positioning level — and how structural traders use that reading to place 0DTE butterfly trades with genuine edge.
What Options Order Flow Really Measures
Options order flow is the continuous stream of buy and sell transactions across every strike and expiration in the options chain. But the value is not in watching individual transactions. It is in understanding what the aggregate of all those transactions means for dealer positioning and future price behavior.
Volume tells you where activity is concentrated. When 50,000 contracts trade at a single SPX strike in one session, that strike matters — not because a “whale” is there, but because the cumulative positioning at that level creates hedging obligations for the dealers who took the other side. High volume concentrations at specific strikes become structural magnets that influence price for the remainder of the session.
Open interest reveals the existing positioning landscape. Volume tells you what happened today. Open interest tells you what is already committed. A strike with 100,000 contracts of open interest represents an enormous hedging obligation. When price approaches that strike, the dealers holding those positions must adjust their hedges — and those adjustments move the market. Open interest is the map of where structural pressure already exists.
The direction of the flow matters less than the positioning it creates. A million dollars of call buying could be a new bullish bet, a hedge against a short stock position, or someone rolling out of an expiring position. You cannot know from the flow alone. But you can know what it does to the dealer’s book — and that is what drives price. This is why aggregate positioning metrics like gamma exposure (GEX) are more useful than individual trade alerts.
How Dealers Transform Flow Into Price Movement
Every options transaction has two sides. When a retail or institutional trader buys calls, a market maker sells them. That market maker is now short those calls — and must hedge.
Dealer hedging is mechanical, not discretional. When a market maker sells you a call option, they immediately buy shares or futures proportional to the option’s delta. If price rises, delta increases, and they must buy more. If price falls, delta decreases, and they sell. This hedging is automatic, governed by risk management systems, and it happens every second of the trading session. It is the primary mechanism through which options order flow becomes price action.
The magnitude of hedging depends on gamma. Gamma measures how fast delta changes as price moves. On 0DTE options, gamma is extreme — small price movements create large changes in delta, which trigger large hedging flows. This is why 0DTE sessions are more volatile than the underlying fundamentals suggest. The options flow is creating its own price action through the dealer hedging channel.
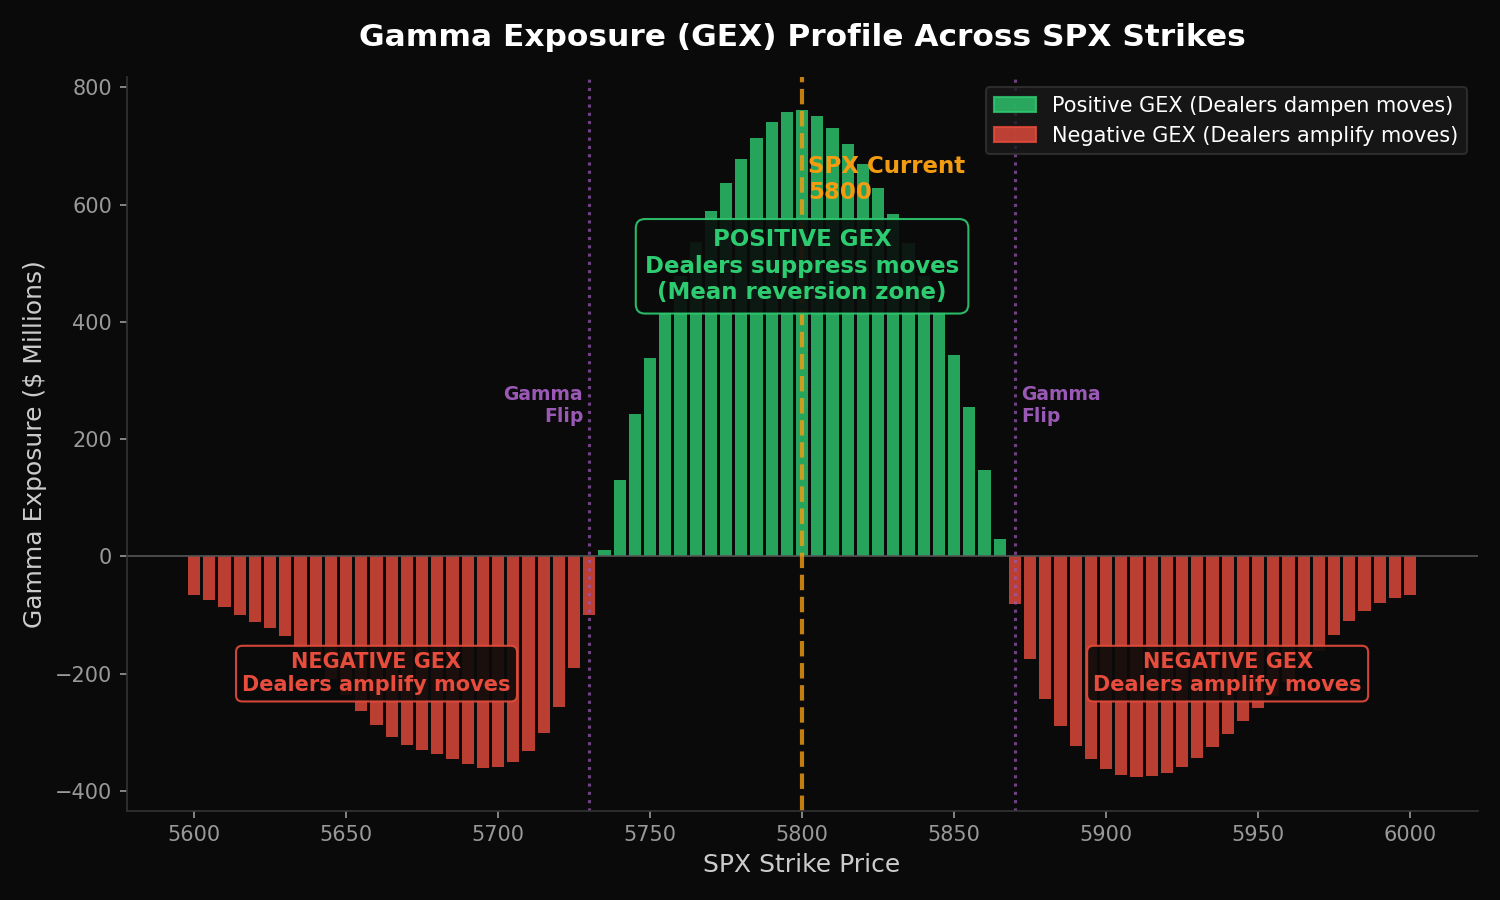
Positive GEX dampens moves. Negative GEX amplifies them. When aggregate dealer positioning is long gamma (positive GEX), their hedging acts as a stabilizer — buying dips and selling rallies. When positioning is short gamma (negative GEX), their hedging amplifies moves — selling into declines and buying into rallies. The flow that created the positioning determines which regime the market operates in. Reading that regime is the first step in every structural trade.
This is the real meaning of flow analysis. It is not about whether more calls or puts traded today. It is about the positioning landscape those trades created and the hedging obligations that follow. Every trade in the options chain either adds to or reduces the structural pressure at a given level — and that pressure is what moves markets.
The Three Flow Signals That Actually Matter
Thousands of data points stream through the options chain every session. Most of them are noise. Three signals distill options order flow into actionable information.
Signal 1: Gamma exposure across strikes. GEX is the single most important derivative of options order flow. It tells you, at every strike, whether dealers will amplify or dampen a move toward that level. The transition point — where GEX flips from positive to negative — is where the market’s behavior changes. Above that level, dealers stabilize. Below it, they accelerate. Every structural trader reads the GEX profile before placing a trade.
Signal 2: Volume and open interest concentration. Where contracts cluster, hedging pressure builds. If the 5600 strike has three times the open interest of surrounding strikes, it acts as a gravitational center — price tends to gravitate toward it or pin near it as dealer hedging flows converge. These concentrations are the structural magnets that give butterfly placements their targets.
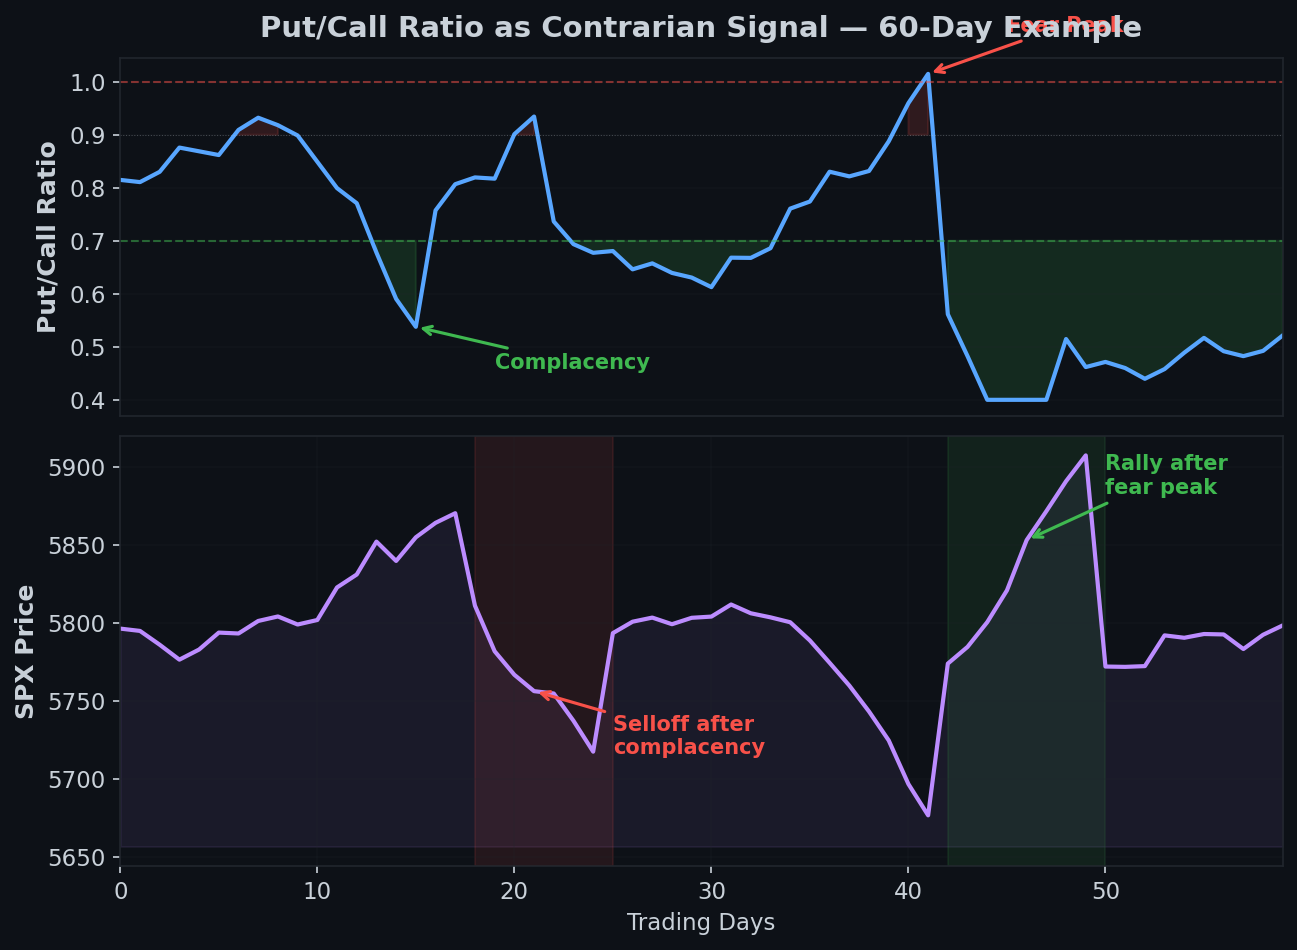
Signal 3: The put/call ratio at the session level. Not the aggregate ratio published on financial news sites — that is too broad. The session-specific put/call ratio on SPX tells you whether today’s flow is skewed toward protection (puts) or speculation (calls). Extreme readings indicate crowded positioning that may unwind — and when crowded positions unwind, the dealer hedging flows create the move.
These three signals — GEX profile, strike concentration, and session put/call skew — are the distillation of millions of transactions into a readable structural map. Everything else — the individual sweeps, the unusual activity alerts, the “dark pool prints” — is noise unless it is contextualized within these three frameworks.
Why Raw Flow Data Misleads Most Traders
The flow tools that most retail traders use show individual transactions. A screen full of big trades scrolling past in real time looks like information. It is usually confusion.
You cannot tell opening from closing trades. A $5 million put buy could be a new bearish bet — or it could be someone closing a profitable short put position. The directional implication is opposite, but the flow tool shows the same thing: a big put trade. Without knowing whether the trade opened or closed a position, you are guessing.
Hedged positions are invisible on a flow screen. An institution that buys $10 million in calls while simultaneously shorting futures has zero directional exposure — it is a volatility trade, not a bullish bet. But the flow tool shows “$10M call sweep” and the chat room goes bullish. The hedging context that gives the trade meaning is not visible in the raw data.
Flow tools show transactions. They do not show positioning. The question is not “what traded?” but “what does the aggregate of all trades mean for dealer positioning and future hedging flows?” A single $2 million call sweep is meaningless. The fact that 80,000 call contracts are now open at the 5650 strike — creating a massive positive gamma pocket that will attract price — is meaningful. The first is a transaction. The second is positioning.
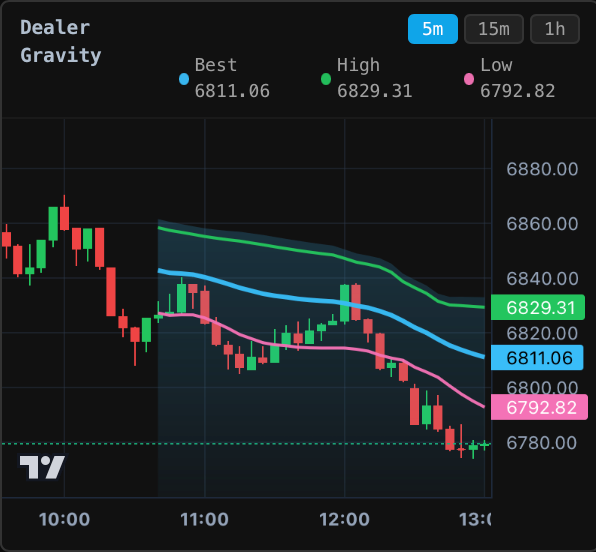
The fix is not better flow tools — it is a better framework. Stop watching individual trades and start reading aggregate positioning. GEX tells you the hedging landscape. Expected move tells you the range the market is pricing. Dealer gravity tells you where positioning concentrations will pull price. These are the outputs of flow — the already-digested signals that you can actually trade on.
From Flow to Structure: Translating Positioning Into Trades
Reading options order flow is not the end goal. Translating that reading into a trade with defined risk and asymmetric payoff is the goal. Here is how structural traders do it.
Step 1: Read the GEX profile to determine the regime. Positive GEX means a compressed range — price is likely to stay contained, and narrow butterflies at the current level work well. Negative GEX means an expanded range — price will move further than expected, and wider structures placed at extremes make more sense. The regime determines the structure type and width before you ever look at a specific strike.
Step 2: Identify dealer gravity levels from open interest concentration. The strikes with the highest open interest and the steepest GEX gradients are the structural magnets. Price does not move randomly during a session — it migrates toward levels where dealer hedging flows converge. These levels are your butterfly placement targets.
Step 3: Use the expected move to bound the range. The expected move — derived from the at-the-money straddle price — defines the market’s implied range for the session. Your butterfly target should fall within this range. If the dealer gravity level sits at the upper boundary of the expected move and GEX is negative above it, you have a structural thesis: price will migrate toward that level and the hedging flows will accelerate the convergence.
Step 4: Place the butterfly and let the positioning work. A butterfly spread placed at the dealer gravity level costs a small debit — your maximum risk. If the flow reading was correct and price converges toward the target, the return is 5x to 25x that debit. If it does not converge, you lose the debit and nothing more. The asymmetry is the edge. The flow reading is what gives the placement its probability.
This is what trading 0DTE structurally actually means. You are not predicting direction. You are reading the positioning landscape that flow created, identifying where hedging pressure will push price, and placing a defined-risk structure at the convergence target. The flow does the work. Your job is to read it correctly and size appropriately.
Sentiment vs Positioning: The Critical Distinction
Flow analysis gets confused with sentiment analysis constantly. They are not the same thing, and the distinction matters.
Sentiment is what traders think. It shows up in surveys, social media, and commentary. “Everyone is bearish” is a sentiment observation. Sentiment can inform contrarian thinking, but it does not move price directly. People can think whatever they want — the market does not care until they commit capital.
Positioning is what traders have done. It shows up in open interest, GEX, and dealer hedging flows. “Dealers are short 50,000 gamma at the 5600 strike” is a positioning observation. Positioning moves price because it creates hedging obligations that execute mechanically, regardless of sentiment. A dealer does not choose whether to hedge — their systems do it automatically.
Sentiment and positioning diverge at the most profitable moments. When sentiment is overwhelmingly bearish but positioning shows massive put open interest about to expire — the unwind of those positions can trigger a rally that confounds the bearish consensus. The gamma squeeze is the extreme version of this: positioning forces a move that sentiment never expected. Reading positioning rather than sentiment is what gives structural traders their edge.
Tools and Platforms for Options Order Flow Analysis
The landscape of flow analysis tools has exploded in recent years. Understanding what each type actually provides helps you avoid paying for noise.
Transaction flow tools show you individual trades. Platforms that alert you to large sweeps, unusual volume, and dark pool prints are showing you transactions — not positioning. These tools are useful for identifying activity spikes, but they require significant interpretation to translate into actionable information. Without understanding whether a trade is opening or closing, hedged or naked, the data is ambiguous.
Aggregate positioning tools translate flow into structure. CBOE publishes daily options volume and open interest data that forms the foundation for positioning analysis. GEX calculations, dealer gravity levels, and expected move derivations take this data and transform it into the structural map that drives 0DTE price action. This is the level where options order flow becomes tradeable.
FOTW’s approach integrates positioning analysis into every session. The GEX overlay, dealer gravity levels, and expected move calculations that FOTW publishes before every session are the end product of flow analysis — positioning data translated into specific levels where structural pressure concentrates. Rather than watching a stream of individual trades and trying to interpret them, FOTW members see the finished map: here is where dealers will stabilize price, here is where they will amplify it, and here is the range the market is pricing for the session.
The best tool is not the one with the most data — it is the one that translates flow into levels you can trade on. A screen full of transaction alerts is not analysis. A GEX profile with identified gravity levels is. The tool you choose should close the gap between “what is happening in the options chain” and “where should I place my butterfly.”
Frequently Asked Questions
What is options order flow?
Options order flow is the continuous stream of buy and sell transactions across all strikes and expirations in the options chain. At the individual level, it shows what contracts are being traded and in what size. At the aggregate level — which is where the real value lies — it reveals how dealer and institutional positioning is shifting, which creates the hedging flows that drive price movement during the session.
How do you read options order flow?
The most effective way to read options order flow is through aggregate positioning metrics rather than individual trade alerts. Gamma exposure (GEX) shows where dealer hedging will amplify or dampen moves. Open interest concentration reveals structural magnets where price gravitates. The session put/call ratio indicates directional skew in current flow. Together, these three signals translate raw flow into a structural map of where price is likely to move.
What is the best options order flow tool?
The best tool depends on what level of analysis you need. Transaction-level tools like Unusual Whales or Cheddar Flow show individual big trades but require significant interpretation. Aggregate positioning tools that calculate GEX, dealer gravity, and expected move — such as what Fly on the Wall provides for its members — translate raw flow into actionable levels. For 0DTE structural trading, aggregate positioning data is more valuable than individual transaction alerts.
Does options order flow analysis work for day trading?
Yes — and it works particularly well for 0DTE options because same-day contracts have the highest gamma, which means dealer hedging flows have the largest impact on price within a single session. On 0DTE, the positioning landscape that flow creates is the primary driver of intraday price action. Structural traders read this positioning before every session and place defined-risk trades at levels where hedging flows are likely to push price.
How does options order flow relate to gamma exposure?
Gamma exposure is the aggregate measure of all the gamma that dealers hold across every strike in the options chain. It is the direct output of options order flow — every trade that opens or closes a position changes the dealer’s gamma exposure at that strike. GEX is the bridge between raw flow data (millions of individual transactions) and actionable positioning information (where dealers will amplify or dampen moves). Reading GEX is reading the structural consequence of all the flow that has already occurred.
Read the Positioning, Not the Tape
Flow data is powerful — but only when you read it at the right level. Individual trade alerts are noise. Aggregate positioning is signal. The traders who profit from flow are not the ones watching every sweep hit the tape — they are the ones reading the positioning landscape that all of those transactions created, and placing defined-risk structures at the levels where that positioning concentrates.
At Fly on the Wall, every session starts with the flow already translated. The GEX overlay shows the hedging landscape. Dealer gravity marks the convergence targets. The expected move defines the range. And the community discusses how the positioning evolves in real time as the session unfolds. You do not need to decode the flow yourself — you need to understand what it means and how to trade on it.
Start with Observer ($17/week) for daily structural analysis including GEX positioning and expected move. Step up to Activator ($97/month) for the real-time GEX overlay, dealer gravity levels, and live execution discussion. Or go all-in with Navigator ($267/month) for daily direct coaching with Ernie on reading flow and positioning for structural trades. Compare all plans here.