


The put/call ratio is one of the simplest and most misused indicators in options trading. It measures the volume of put options traded relative to call options — a single number that reflects the aggregate positioning of the entire options market. When more puts trade than calls, the ratio rises above 1.0. When more calls trade than puts, it drops below 1.0. That is the entire calculation. What matters is how you interpret it.
Most traders treat the put/call ratio as a directional signal. Ratio above 1.0 means bearish, below 1.0 means bullish. This surface-level reading is why most traders lose with it. The ratio does not predict direction. It measures positioning — and positioning tells you where the fuel is for the next move, not which direction the move will go. Understanding this distinction is what separates traders who use the ratio structurally from those who use it as a coin flip.
This guide explains what the put/call ratio measures, how to read the CBOE data, what the SPY ratio reveals about retail versus institutional flow, and how structural 0DTE traders integrate it into the pre-session process.
What Is the Put/Call Ratio?
The put/call ratio divides total put volume by total call volume for a given period. If 2 million puts and 2.5 million calls traded on SPX today, the ratio is 0.80 (2.0 / 2.5). If 3 million puts and 2 million calls traded, the ratio is 1.50.
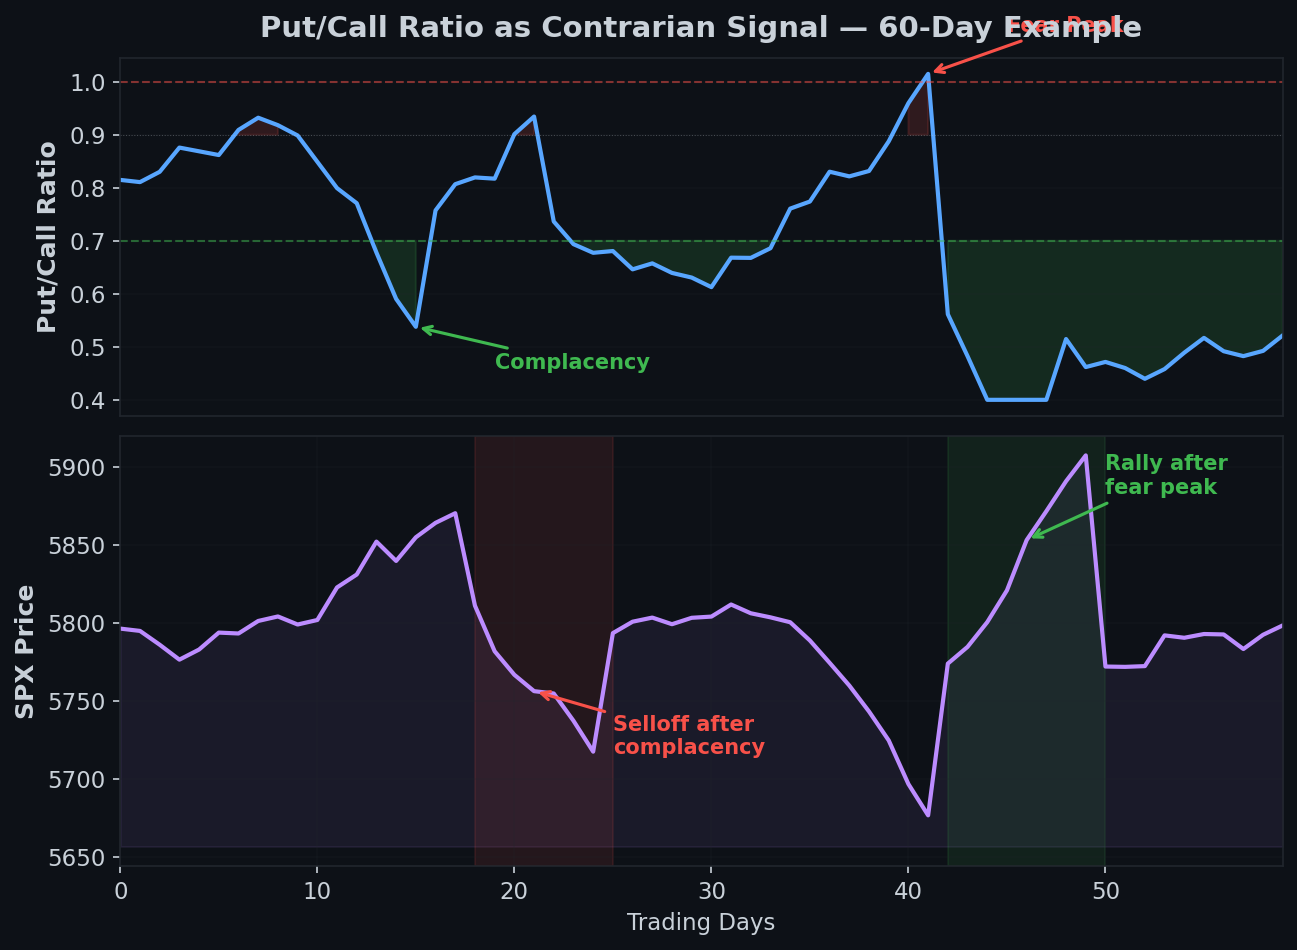
The neutral baseline sits around 0.70 to 0.90 for equity options. This reflects the market’s structural bias toward call buying — most participants are long equities and buy calls for upside exposure or sell puts for income. A ratio consistently below 0.70 signals aggressive call buying (complacency). A ratio consistently above 1.0 signals aggressive put buying (fear or hedging).
The number alone means nothing without context. A put/call ratio of 1.2 during a sharp selloff means something different than 1.2 during a slow grind higher. In the first case, traders are panic-hedging — reactive positioning that often marks a bottom. In the second case, institutional accounts may be accumulating protective puts ahead of an anticipated event — proactive positioning that signals informed caution.
The ratio is a sentiment gauge, not a trade signal. It tells you where the crowd is positioned. What you do with that information depends on your framework.
How to Read the Numbers
Reading the put/call ratio requires understanding what drives it — and what distorts it.
Volume versus open interest. The daily ratio uses volume — how many contracts traded today. This captures real-time sentiment. Open interest — how many contracts are currently held — tells you about accumulated positioning. Both matter, but the daily volume ratio is what most traders reference for short-term reads.
The ratio moves in ranges, not levels. A single day’s reading is noise. The 5-day and 10-day moving averages smooth the signal and reveal whether positioning is trending toward fear or complacency. When the 10-day moving average of the equity put/call ratio exceeds 0.95, it historically corresponds with market bottoms — not because the ratio predicts a reversal, but because extreme hedging activity means the fuel for a short squeeze is already in place.
Extreme readings are the only ones that matter. A ratio between 0.70 and 0.90 tells you nothing actionable — the market is in equilibrium. Below 0.50 or above 1.20, positioning is stretched. Stretched positioning does not guarantee a reversal, but it tells you where the energy is stored. When it unwinds, the move can be violent.
Context determines interpretation. Always pair the ratio with GEX data and the VIX regime. A high put/call reading in a positive GEX environment means dealer hedging will dampen any selloff — the fear is overdone. A high reading in a negative GEX environment means dealer hedging will amplify the move — the fear may be justified.
CBOE Put/Call Ratio vs Equity Ratios
Not all put/call ratios measure the same thing. The CBOE publishes three variants, and confusing them is a common mistake.
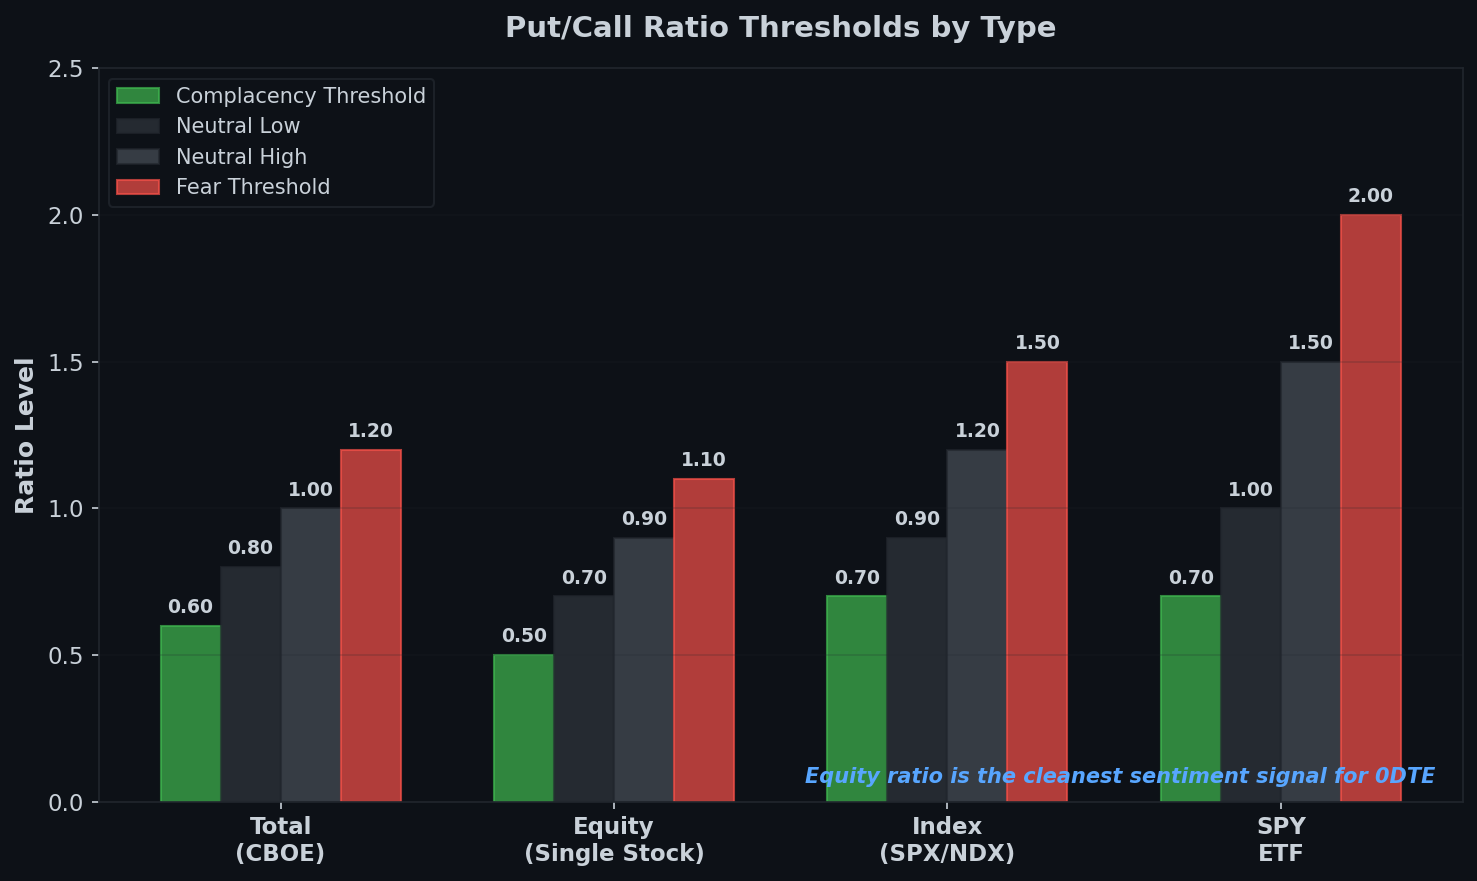
The Total Put/Call Ratio includes all options traded on the CBOE — equity, index, and ETF. This is the broadest measure but also the noisiest, because it mixes retail equity flow with institutional index hedging. A high total ratio might just mean institutions are rolling their quarterly index hedges, which says nothing about directional sentiment.
The Equity Put/Call Ratio measures only single-stock options. This is the best gauge of retail and speculative sentiment because individual equity options are predominantly traded by retail participants and active funds. When the equity ratio spikes above 0.95, retail traders are aggressively buying puts — often a contrarian signal that fear has peaked.
The Index Put/Call Ratio measures options on indices like SPX, NDX, and RUT. Index options are dominated by institutional hedgers and market makers. A high index ratio often reflects programmatic hedging rather than directional conviction. It is less useful as a sentiment indicator and more useful as a measure of institutional risk appetite.
For 0DTE structural trading, the equity ratio is the primary signal. It captures the speculative positioning that creates fuel for intraday moves. The index ratio is secondary — useful for understanding the hedging backdrop but not for timing entries.
What the SPY Ratio Reveals
The SPY put/call ratio deserves special attention because SPY is the most actively traded ETF in the world and its options flow bridges the gap between retail and institutional activity.
SPY options carry a structural put skew. Institutions use SPY puts for portfolio hedging, pension funds write covered calls against SPY holdings, and retail traders use SPY options for both speculation and protection. This means the SPY ratio naturally sits higher than the broad equity average — around 1.0 to 1.5 under normal conditions.
When the SPY ratio exceeds 2.0, the market is heavily hedged. This level of put buying creates significant negative delta that dealers must manage. As those puts approach expiration without the market collapsing, the unwinding of hedges releases upward pressure. This is the mechanical link between extreme put/call readings and subsequent rallies — it is not prediction, it is positioning mechanics.
When the SPY ratio drops below 0.70, complacency is elevated. Heavy call buying and minimal put protection means the market is leaning hard in one direction. Any negative catalyst — economic data, geopolitical event, earnings miss — meets a market with no hedges in place. The resulting selloff is amplified because everyone needs to hedge simultaneously, spiking implied volatility and creating cascading pressure.
The SPY ratio is most useful intraday on event days. Before FOMC, CPI, or NFP releases, watching SPY put/call flow in real time reveals whether the market is positioning for protection or chasing upside. This informs butterfly placement — if heavy puts suggest the crowd expects a selloff and the data comes in neutral or positive, the squeeze toward GEX-positive levels is your convergence target.
Put/Call Ratio and Market Sentiment
The put/call ratio is a contrarian indicator at extremes and irrelevant in the middle. This is the central principle that most traders fail to apply.
Extreme fear creates buying opportunities. When the ratio spikes — above 1.1 on the equity ratio, above 2.0 on SPY — the market is saturated with protective positioning. Historically, these readings correspond with short-term bottoms. Not because fear predicts reversals, but because the act of hedging itself depletes selling pressure. Once everyone who wants protection has it, there are no incremental sellers left. Price stabilizes and the unwind begins.
Extreme complacency creates risk. When the ratio collapses — below 0.50 on the equity ratio — traders are aggressively bullish with minimal hedging. This is the setup for sharp corrections. Not because optimism predicts selloffs, but because the absence of hedges means any negative catalyst meets an unprotected market. The resulting volatility spike and put scramble amplify the move.
The ratio is useless in the middle. Between 0.65 and 0.95, the equity ratio reflects normal market activity. No edge exists in reading normal positioning. Traders who try to extract signals from every daily reading end up overtrading — reacting to noise rather than waiting for the extremes that actually contain information.
Combine with VIX for regime confirmation. A high ratio plus a VIX above 25 confirms genuine fear. A high ratio plus a VIX below 17 is more likely institutional rebalancing than panic. The expected move derived from VIX tells you how large the anticipated range is — the ratio tells you which direction the crowd is positioned for.
How 0DTE Traders Use the Ratio
Structural 0DTE traders do not trade the put/call ratio directly. They use it as one input in a multi-factor pre-session process.
Step 1: Check the 5-day moving average before the open. Is positioning trending toward fear or complacency? An elevated 5-day average means the market has been hedging — squeeze potential is building. A depressed 5-day average means the market is leaning bullish — reversal risk is elevated.
Step 2: Overlay with GEX positioning. A high ratio plus negative GEX is the setup for a violent move in either direction — dealer hedging will amplify whatever happens. A high ratio plus positive GEX means the selloff fears are likely overdone — dealers will stabilize price. This combination determines whether you widen or narrow your butterfly.
Step 3: Read intraday flow on event days. On CPI, FOMC, and NFP days, the pre-release put/call flow reveals positioning intent. If put volume surges before the release, the crowd is positioned for downside. If the data comes in neutral or positive, the positioning unwind fuels a rally. Place the butterfly body where GEX suggests price will stabilize after the positioning resolves.
Step 4: Do not use the ratio as an entry trigger. The ratio informs your thesis — it shapes how wide you build, where you place the body, and how you size the trade. It does not tell you when to click the button. Timing comes from price action and the expected move range, not from a sentiment gauge.
Common Mistakes With This Indicator
Trading the ratio as a signal. The ratio is context, not a trigger. Buying calls because the ratio is high or buying puts because it is low is a recipe for consistent losses. The ratio tells you about fuel — not about when the spark arrives.
Ignoring the denominator. A rising ratio does not always mean more puts are being bought. It can also mean call volume is declining while put volume stays flat. Always check absolute volumes alongside the ratio. A spike in the ratio on low total volume is meaningless — it is just one side of the market going quiet.
Using the total ratio instead of the equity ratio. The total CBOE ratio is contaminated by institutional index hedging that has nothing to do with directional sentiment. Traders who reference the total ratio are reading a composite signal that blends genuine fear with routine risk management. The equity ratio is cleaner.
Looking at a single day. One day’s reading is statistical noise. The 5-day and 10-day moving averages are where the information lives. A ratio of 1.3 on a single day might reverse to 0.7 the next — the smoothed trend reveals whether positioning is genuinely stretched or just experiencing a normal fluctuation.
Confusing hedging with conviction. A high ratio does not mean the market will fall. It means participants are buying protection. Protection is often purchased at exactly the wrong time — after a selloff has already occurred and fear is peaking. The mechanical process of hedging often marks the end of the move, not the beginning.
Frequently Asked Questions
What is the put/call ratio?
The put/call ratio divides total put option volume by total call option volume. A ratio above 1.0 means more puts are trading than calls, indicating elevated hedging or bearish positioning. A ratio below 1.0 means more calls are trading, indicating bullish positioning. It measures market sentiment through the lens of options flow.
What does a high put/call ratio mean?
A high reading means traders are buying more puts than calls — typically a sign of fear, hedging activity, or bearish speculation. Counterintuitively, extreme readings above 1.1 on the equity ratio have historically corresponded with short-term market bottoms because saturated hedging depletes selling pressure and creates the conditions for a positioning unwind.
How do you use the put/call ratio for trading?
Use it as a contrarian sentiment gauge at extremes only. When the equity ratio exceeds 1.0, positioning is stretched toward fear — watch for stabilization signals. When it drops below 0.55, complacency is high — watch for reversal risk. Combine it with GEX data and the VIX regime to determine whether the positioning has structural follow-through or is overdone.
What is the difference between the equity and index put/call ratio?
The equity ratio measures single-stock options and primarily reflects retail and speculative sentiment. The index ratio measures options on SPX, NDX, and other indices and primarily reflects institutional hedging. The equity ratio is more useful for gauging directional sentiment, while the index ratio measures the hedging backdrop.
Is the SPY put/call ratio a reliable indicator?
The SPY ratio is useful at extremes. Above 2.0, the market is heavily hedged and squeeze potential is high. Below 0.70, complacency is elevated and reversal risk increases. Between those extremes, the SPY ratio reflects normal activity and provides no actionable edge. Always combine it with GEX positioning and the VIX regime for confirmation.
Read the Positioning, Not the Prediction
The put/call ratio does not predict the market. It reveals where the market is positioned — and positioning determines the mechanics of the next move. Extreme fear means the fuel for a rally is in place. Extreme complacency means the fuel for a selloff is in place. Neither tells you when the move happens — only that the energy is stored.
At Fly on the Wall, the ratio is one input in a structural pre-session process that includes GEX positioning, the expected move, and VIX regime classification. When these inputs align — extreme positioning, directional GEX, and a catalyst on the calendar — the butterfly placed at the convergence target captures the resolution. The ratio does not generate the trade. It sets the stage.
Start with the Observer for daily structural analysis including positioning data and the expected move before every session. Step up to Activator for full execution tools, real-time GEX overlay, and weekly coaching. Or go all-in with Navigator for daily direct coaching with Ernie. Compare all plans here.