


The VIX explained in simple terms: it’s the market’s best estimate of how much the S&P 500 will move over the next 30 days. Often called the “fear gauge,” the CBOE Volatility Index translates options prices into a single number that tells you whether traders expect calm or chaos. Understanding what the VIX is, how it’s calculated, and what it actually means for your trading is foundational knowledge for anyone working with SPX options.
But the VIX is widely misunderstood. It doesn’t predict direction. It doesn’t measure fear in any literal sense. And it doesn’t tell you whether the market will go up or down. What it does tell you — with remarkable precision — is how expensive options are right now relative to the movement the market expects. That information changes everything about how you size positions, select strategies, and manage risk.
This guide breaks down the VIX from first principles: what it measures, how to read it, what different levels mean, and how experienced 0DTE traders use it every single session.
What Is the VIX Index?
The VIX — formally the CBOE Volatility Index — measures the market’s expectation of 30-day volatility for the S&P 500, derived from the prices of SPX options. It was created by the Chicago Board Options Exchange in 1993 and has become the single most referenced volatility indicator in global markets.
Here’s the intuition: when traders are nervous about future uncertainty, they buy more options for protection. This increased demand pushes options prices (specifically implied volatility) higher. The index captures this by aggregating implied volatility across a wide range of SPX option strikes and converting it into an annualized percentage.
A reading of 20 means: the options market expects the S&P 500 to move approximately 20% over the next year, or roughly 1.26% per day (20 ÷ √252 trading days). This daily expected move is directly tied to the expected move you see priced into SPX options.
How Is the Volatility Index Calculated?
The VIX calculation is more nuanced than simply averaging implied volatilities. It uses a model-free methodology based on the prices of out-of-the-money SPX puts and calls across two near-term expiration cycles.
Key inputs to the VIX calculation:
- SPX option prices: Both puts and calls across a wide range of strikes, weighted by their distance from the at-the-money strike
- Two expiration cycles: Near-term and next-term SPX options, interpolated to produce a constant 30-day measure
- Out-of-the-money options only: OTM puts below the forward price and OTM calls above it, which isolates pure volatility premium from intrinsic value
- Treasury rate: Used to discount option prices to present value
The result is a number that represents annualized expected volatility. The formula strips out directional bias — it doesn’t care whether traders are buying puts (bearish) or calls (bullish). It only cares about the total amount of volatility premium embedded in options prices.
You don’t need to calculate the VIX yourself — it updates in real time on every major platform. What matters is understanding what the number means for your trading decisions.
Reading the Numbers: What Different Levels Mean
The index doesn’t exist in a vacuum. Its significance comes from context — where it is relative to recent history and what regime the market is operating in.
Below 15: Low Volatility (Zombieland)
A VIX below 15 indicates extreme complacency. Options are cheap, daily ranges are narrow, and the market is pricing in minimal risk. This environment is commonly called “Zombieland” because price action tends to be slow, grinding, and directionally muted.
What it means for traders:
- Options premiums are compressed — selling strategies like iron condors and credit spreads collect less premium for the same risk
- Butterfly spreads are cheap to enter but require precise placement due to narrow ranges
- Long volatility strategies (straddles, strangles) bleed theta rapidly with insufficient movement to compensate
- Complacency often precedes volatility spikes — it can’t stay below 15 forever
15-24: Normal Volatility (Goldilocks)
This is the “Goldilocks zone” — not too hot, not too cold. Options are reasonably priced, daily ranges are tradeable, and both directional and volatility strategies can function. Most of the time (roughly 60-70% historically), the VIX lives in this range.
What it means for traders:
- Options premiums are fair — neither overpriced nor compressed
- Most strategies work in this environment, making strategy selection less critical than execution
- Straddle pricing reflects reasonable expected moves
- This is the environment where risk management discipline matters most — because nothing about the environment forces caution
24-32: Elevated Volatility
Elevated VIX readings signal that the market is pricing in significantly larger moves. This often coincides with emerging concerns — geopolitical tension, unexpected economic data, or mounting technical damage in the index.
What it means for traders:
- Options premiums are rich — sellers can collect more premium, but the risk of large moves is genuinely higher
- Position sizes should decrease. The same notional butterfly costs more and the underlying can move further
- Debit spreads become more expensive but wider moves increase the probability of reaching profit zones
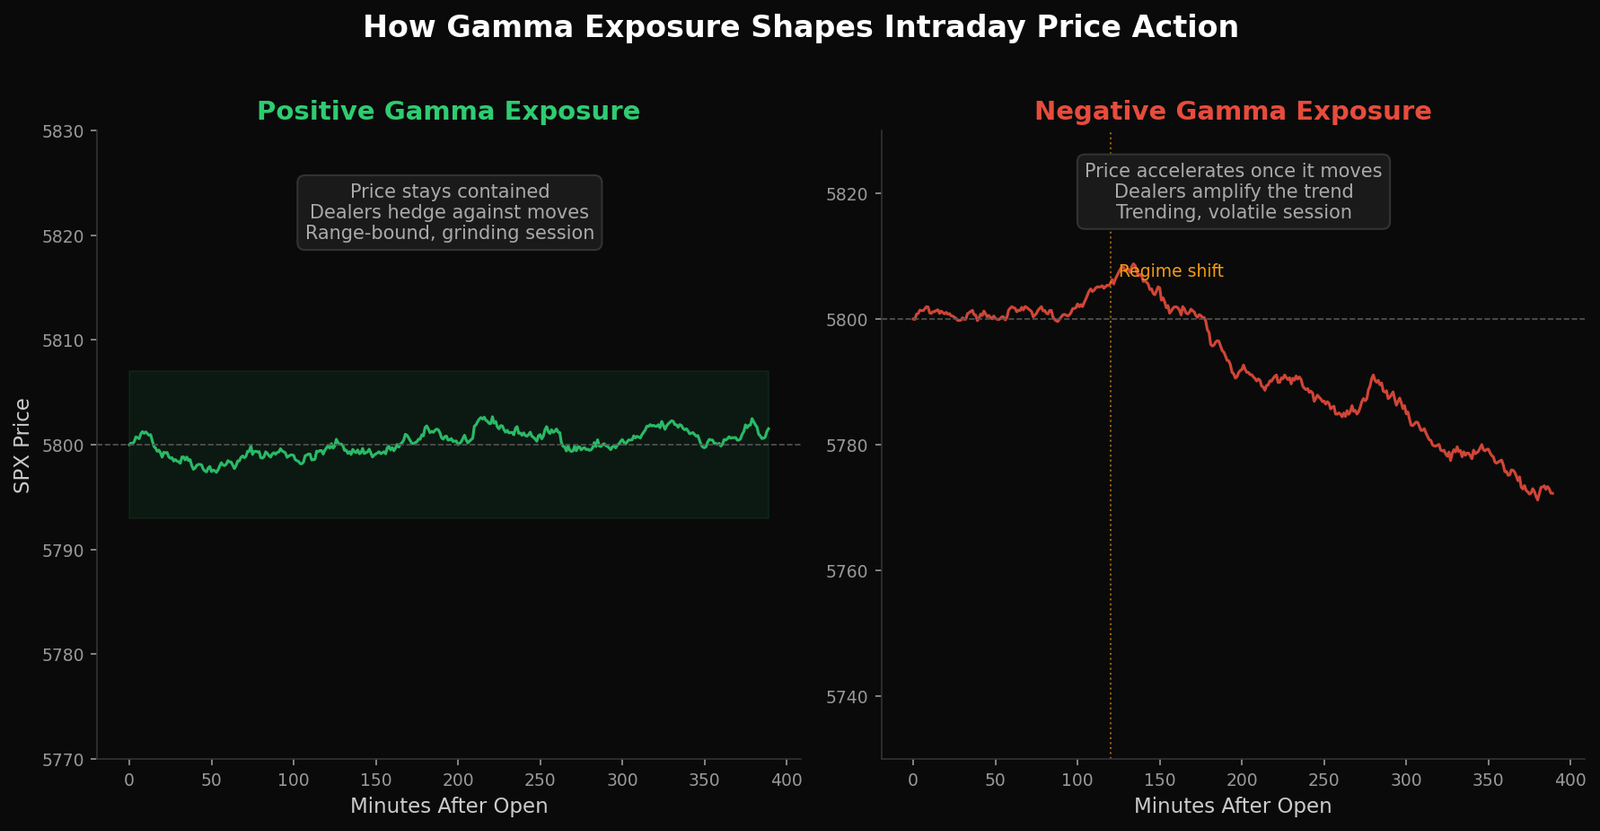
- Gamma exposure effects are amplified — GEX levels have more impact on intraday price action
Above 32: Chaos
A VIX above 32 is a structural break from normal conditions. This level has historically been associated with genuine market crises — COVID crash (VIX hit 82), the 2008 financial crisis (VIX hit 80), August 2024 (VIX spiked to 65). In these environments, normal option pricing relationships can temporarily break down.
What it means for traders:
- Options are extremely expensive — but the market is telling you the risk is real
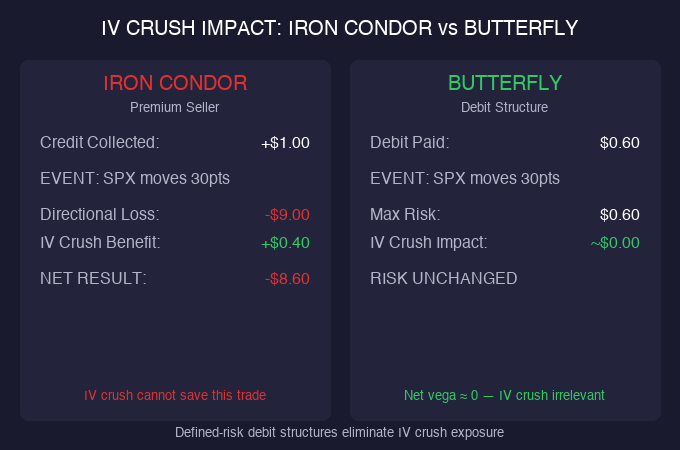
- Undefined-risk strategies become dangerous. Short straddles and naked options can produce catastrophic losses
- Defined-risk strategies are essential. Iron butterflies and vertical spreads cap your maximum loss
- Liquidity can deteriorate — bid-ask spreads widen significantly, making entries and exits more expensive
- Survival becomes the priority. This is not the environment for aggressive position sizing
The Expected Move Connection
The VIX directly connects to the expected move in SPX options. Here’s the conversion:
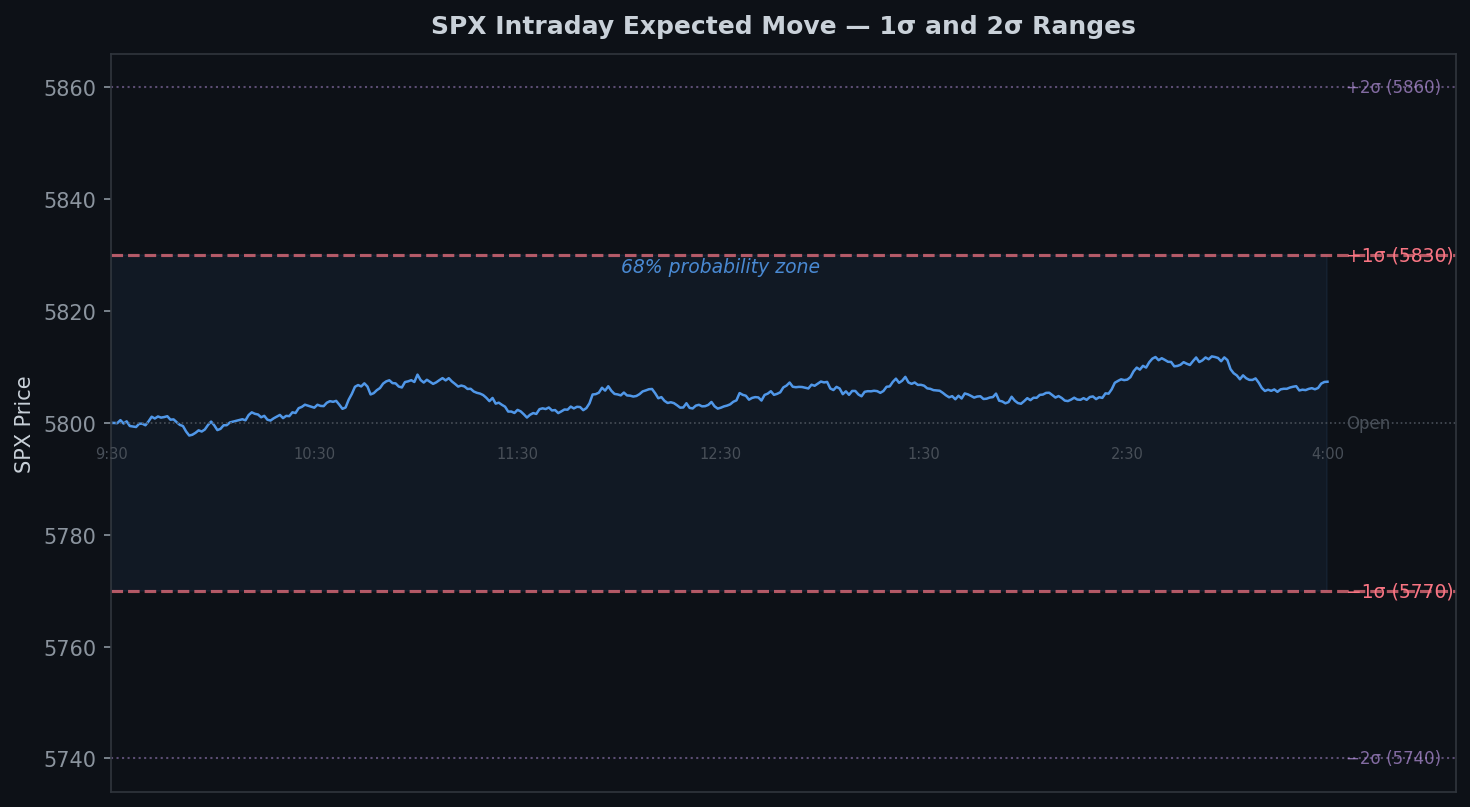
Daily expected move = (VIX / √252) × SPX price
For example, with VIX at 20 and SPX at 5800:
- Daily expected move = (20 / 15.87) × 5800 = ~73 points
- This means the options market expects SPX to move roughly ±73 points in a single day (one standard deviation, ~68% probability)
This calculation is critical for 0DTE traders because it tells you:
- Where to place butterfly wings: A butterfly placed outside the expected move has lower probability but higher potential payoff
- Whether credit spread strikes are reasonable: Selling strikes inside the expected move means you’re betting against the statistical consensus
- How to size positions: Higher volatility → wider expected move → each contract carries more risk → reduce size
Implied Volatility vs the Index: What’s the Difference?
Traders often confuse the VIX with implied volatility (IV). They’re related but distinct:
Implied volatility is a property of individual options. Each option contract has its own IV, derived from its market price. IV can vary significantly across strikes (this creates the “volatility smile” or “skew”) and across expirations (the term structure). IV crush refers to the rapid decline in an individual option’s IV after an anticipated event.
The VIX is an aggregate measure that synthesizes implied volatility across hundreds of SPX options into a single number. It represents the market’s overall expectation for 30-day volatility, not the IV of any single contract.
In practice, when the index rises, most individual SPX option IVs rise as well — but not uniformly. OTM puts typically see IV increase faster than calls (skew steepens), and near-term options react more dramatically than longer-dated ones.
How 0DTE Traders Use the VIX
For traders working with same-day expiration 0DTE options on SPX, the VIX is a session-defining input. Here’s how it shapes decisions:
Strategy Selection by Regime
Low VIX (below 17): Narrow expected moves favor precision plays. Butterflies need tight placement. Credit spreads collect less premium, making the risk/reward less attractive. Consider smaller positions or waiting for a better setup.
Normal VIX (17-24): The broadest strategy menu. Butterflies, iron condors, debit spreads, and directional trades all have reasonable risk/reward profiles. Focus shifts to execution quality and Greeks management.
High VIX (24+): Only defined-risk strategies. Position sizes cut in half or more. Wider butterfly wings to account for larger moves. Strict time-based exits to avoid late-day gamma squeezes. This is the environment where discipline pays the most.
Position Sizing Adjustment
The VIX should directly influence how much capital you allocate per trade. A butterfly that costs $1.50 when VIX is 15 might cost $3.50 when VIX is 30. The cost increase reflects genuinely higher risk — the underlying can move further, faster. Keeping the same number of contracts at higher VIX means you’ve silently doubled your risk. Scale down as the VIX scales up.
Intraday Monitoring
The index updates throughout the trading day. Sharp spikes during a session signal that real-time hedging demand is increasing — often preceding larger moves in SPX. Conversely, a declining reading during a session indicates options sellers are gaining confidence and premiums are compressing. Watch volatility levels alongside put/call ratio data for a complete picture of market positioning.
Common Misconceptions Traders Get Wrong
“High VIX means the market will crash.” Not necessarily. VIX measures expected volatility in both directions. A VIX of 30 means the market expects large moves — which could be up or down. Some of the strongest rallies in history have occurred during elevated VIX readings as the market rebounds from oversold conditions.
“Low VIX means the market is safe.” Dangerous assumption. Low readings mean the market is pricing in small moves right now. Volatility is mean-reverting — extremely low readings tend to precede volatility expansion, not continued calm. The lowest VIX readings of 2017-2018 preceded the February 2018 “Volmageddon” event.
“The VIX predicts the future.” The index reflects current options pricing, which embeds forward expectations. But it’s a consensus estimate, not a crystal ball. Realized volatility frequently differs from implied volatility — sometimes the market moves more than expected, sometimes less. The VIX is an input for calibrating your risk management, not a forecast to trade against blindly.
“VIX and SPX always move in opposite directions.” They’re negatively correlated on average (~-0.75), but not always. There are periods where both VIX and SPX rise simultaneously (usually during strong rallies with increasing uncertainty) or where both decline. Treat the correlation as a tendency, not a law.
Term Structure and Contango
The volatility index has a term structure — different expiration months can have different levels. Under normal conditions, the term structure is in “contango,” meaning longer-dated VIX futures trade above the spot VIX. This reflects the uncertainty premium — the further out you look, the more uncertainty exists.
When the term structure inverts (called “backwardation”), with near-term readings higher than longer-term, it signals acute fear. The market is pricing in more near-term risk than long-term risk — a sign that something urgent is driving hedging demand. VIX term structure inversions have historically coincided with significant market stress events and are worth monitoring as a regime indicator.
Frequently Asked Questions
What does the VIX measure?
The VIX measures the market’s expectation of 30-day volatility for the S&P 500, derived from the prices of SPX options. It represents annualized expected volatility as a percentage. A VIX reading of 20 means the options market expects the S&P 500 to move approximately 20% over the next year, or about 1.26% per day.
What is a normal VIX level?
The long-term historical average of the VIX is approximately 19-20. Readings below 15 are considered low volatility, 15-24 is the normal range where the VIX spends most of its time, 24-32 indicates elevated volatility, and anything above 32 signals crisis-level conditions. During the COVID crash in March 2020, the VIX peaked above 82.
Does a high VIX mean the market will go down?
No. The VIX measures expected magnitude of movement, not direction. A high VIX means the market expects large moves, which could be up or down. Some of the strongest market rallies have occurred during periods of elevated VIX as the market rebounds from oversold conditions.
How does the VIX affect options prices?
The VIX and options prices move together because the VIX is derived from options prices. When the VIX rises, SPX options become more expensive across the board as implied volatility increases. This means strategies that buy options (straddles, debit spreads) cost more to enter, while strategies that sell options (iron condors, credit spreads) collect more premium but carry higher risk.
Can you trade the VIX directly?
You cannot buy or sell the VIX index directly. However, you can trade VIX futures, VIX options, and VIX-related ETPs like VXX and UVXY. These products track VIX futures, not the spot VIX, which means they behave differently due to contango roll costs and term structure effects. Most 0DTE SPX traders use the VIX as an informational input rather than a tradeable instrument.